Om Prakash Chouhan1* and Hansa Chouhan2
1Department of Chemistry, Saifia Science College, Barkatullah University, Bhopal, India
2Department of Physics, Govt. M. L. B. College, Barkatullah University, Bhopal,India
DOI : http://dx.doi.org/10.13005/msri/110110
Article Publishing History
Article Received on : 22 Jun 2014
Article Accepted on : 18 Jul 2014
Article Published : 16 Aug 2014
Plagiarism Check: Yes
Article Metrics
ABSTRACT:
The present paper deals with the study of sulphonylurea glipizide (GLP) drug in order to give a thought concerning its coordinating potentiality towards some inner transition metals. Metal complex of GLP drug issynthesized and characterized by using analytical data, molar conductance, X-ray diffraction and thermogravimetric analysis (TGA and DTA) studies. From the analytical data, the complex is proposed to have general formula(C21H26N5O4S)2Sm(OH2)4.Low values of molar conductance indicate that complex have non ionic nature. The conductometric titration using monovariation method reveal that complexis L2M type which is further confirmed by Job’s method of continuous variation as modified by Turner and Anderson. Geometery of complex is assigned to be hexagonal in which ligand molecules lie horizontally joining the central metal atomand four water molecules attached vertically and horizontally with the metal, supported by spectroscopic study. Powder X-ray diffraction data have been used to calculate particle size, porosity, volume of unit cell and density of synthesized complex.The thermal decomposition of complex is studied using thermogravimetric (TGA) and differential thermal analysis (DTA) techniques. The kinetic parameters such as, energy of activation (Ea), enthalpy (ΔH), entropy (ΔS) and free energy change (ΔG) of the complexis evaluated by employing the Freeman-Carroll and Sharp-Wentworth methodsand the relative thermal stability of the complexisalso discussed.
KEYWORDS:
Glipizide; antidiabetic drug; metal complex; X-ray diffraction; TGA and DTA.
Copy the following to cite this article:
Chouhan P O., Chouhan H. X-ray Diffraction and Thermal Characterization Study of Samarium3 Complex of Sulphonylurea, Glipizide: An Oral Antidiabetic Drug. Mat.Sci.Res.India;11(1)
|
Copy the following to cite this URL:
Chouhan P O., Chouhan H. X-ray Diffraction and Thermal Characterization Study of Samarium3 Complex of Sulphonylurea, Glipizide: An Oral Antidiabetic Drug. Mat.Sci.Res.India;11(1). Available from: http://www.materialsciencejournal.org/?p=365
|
Introduction
The term diabetes mellitus describes a metabolic disorder of multiple etiologies characterized by chronic hyperglycemia with disturbances of carbohydrate, fat and protein metabolism resulting from defects in insulin secretion, insulin action or both1. Currently diabetes mellitus is a great threat to the world community with more than 100 million persons suffering from diabetes. The prevalence and incidence of diabetes is increasing in most populations, being more prominent in developing countries as follows, in USA more than 16 million, in republic of China more than 14 million, in Africa more than 20 million. India leads the world largest number diabetic subjects and is being termed the “diabetic capital of the world”with 40.9 million people currently suffering from diabetes and expected to rise 69.9 million by 20252.
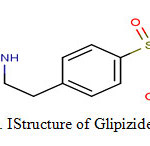
For treatment of diabetes, carbutamide became the first clinically useful sulphonylurea but it was later withdrawn because of its undesirable effects on the bone marrow. This compound led to the development of entirely novel class of oral antidiabetic’s viz. sulphonylureas. Tolbutamide and chlorpropamide were the first widely used members of this group. Since then, about 12000 sulphonylureas have been tested3-4. The first generation sulfonylureas are still in use, but are less effective than the more recently introduced second generation drugs like gliclazide, glimepiride, glibenclamide and glipizide5. An important difference between the older and newer sulfonylureas is a higher specific binding of the latter to pancreatic β-cells. Therefore, the newer sulfonylureas, such as glipizide, are more active6. Chemically, glipizide is a substituted aryl sulphonylurea.Its empirical formula is C21H27N5O4S, molecular weight is 445.55 and IUPAC name is 1-cyclohexyl-3-[[p-[2-(5-methyl pyrazine carboxami do)ethyl]phenyl]sulfonyl]urea7scheme 1.It is white to almost white crystalline odourlesspowder prepared by chemical synthesis. It is practically insoluble in water, alcohol and readily soluble in dimethylformamide (DMF). Its melting range is 208-209oC.
Glipizide is one of the most commonly prescribed drugs for treatment of type 2diabetesmellitus8. Its main features are swift and short action with a very high selectivity9-10.It is about 100 times more potent than tolbutamide in evoking pancreatic secretion of insulin11. Major effect of glipizide is to enhance insulin availability following meals, whilstit has little influence on nocturnal glucose control12. The study of chemistry and chemical reaction of co-ordination compound help in establishing structure activities relationship. It has been reported that in biological activity metal complexes are more potent and less toxic as compared to the free ligand13-16. Recently, metals in medicine have been recognized internationally as an important area for research and much attention has been given to the use of sulphonylureas with inner transition metals because of their high complexing nature17-18.In this account, we have undertakenthe samarium(Sm)metalcomplex of glipizide drugfor study. The metal complex was characterised by using different physico chemical methods like elemental analyses (C, H, N, S and metal content), X-ray diffaraction and TGA/DTA techniques.
Experimental
2.1 Ligand- Metal ratio
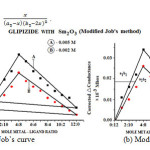
(a). To find out the ligand metal ratio, initially conductometric titration using monovariation method were carried out at 27±1 ºC and 0.005 M solution of glipizide drug was prepared in DMF(dimethylformamide). Similarly, solution of samarium trioxide (Sm2O3) wasprepared in the ethanol of 0.01M concentration. 20ml of ligand was diluted to 200 ml with the same solvent. The ligand was titrated conductometrically against metal salt solution taken in burette using fraction of 1ml. Conductance was recorded after each addition with proper stirring. Results were plotted in the form of graph between corrected conductance and volume of metal salt added. From the equivalence point in the graph, ratio between ligand and metal were noted to be 2:1 (L2M).
(b). Formation of the complex in 2:1 (L2:M) ratio was also confirmed by Job’s method19of continuous variation as modified by Turner and Anderson,20usingconductance as index property Fig. 1 (a)-(b), from these values the stability constant (log k) and free energy change (DF), were also calculated by using formula21-24;

2.2 Material and Method
All chemicals used were of the analytical grade (AR) and of highest purity available. They include pure sample of glipizide was received as a gift from M/s Zim Laboratories Limited Kalmeshwar (M.S.) India. The metal salt of (Sm2O3)obtained from Hi media Laboratory, Mumbai, India. Organic solvents used included absolute ethanol and DMF. De-ionised water was generally used in all synthesis.
2.3 Synthesis of metal complex
A weighed quantity of “Glipizide” (2 mol) was dissolved separately in minimum quantity of DMF. The solution of (Sm2O3) wasprepared by dissolving separately in the ethanol. Ligand solution was added slowly with stirring into the solution of metallic salt at room temperature; maintain the pH between 6.0 to 6.5 by adding dilute NaOH solution. On refluxing the mixture for 3-4 h at 60oC and on cooling, light yellow crystal was collected by filteration, washed several times with DMF and ethanolfinally dried in vacuum and weighed.
2.4 Instrumentation
Molar conductance of complexwas measured by using Systronics Digital Conductivity meter. Melting point was determined by Perkin Elmer Model melting point apparatus and is uncorrected. The elemental analysis of the isolated complexwas carried out by using Coleman Analyzer Model at the Departmental Micro Analytical Laboratory, CDRI, Lucknow, India. X–ray diffraction studies was carried out by X–ray diffractometer model with 45kV rotating anode and Cukα (1W=1.54060A°) radiation at Punjab University, Chandigarh, India. The samplewas scanned in the range 10.0084 to 79.9804 (2θ) powder data were indexes using computer software (FPSUIT V2.0).
The thermogravimetric analysis (TGA/DTA) were carried out in dynamic nitrogen atmosphere (20 ml.min-1) with a heating rate of 10°Cmin-1 using shimatzu TGA-50H Thermal Analyzer at IIT Bombay, India.
RESULTS AND DISCUSSION
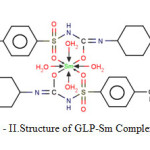
The synthesized complexislight yellow, being soluble in DMSO and insoluble in water, ethanol etc. Analytical data and conductometric studies suggest 2:1 (L:M) ratio.The proposed structure for the complex is shown in scheme- II
3.1 Composition of metal complex
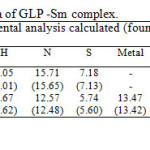
The isolated solid complex ofsamariummetal ions with the GLP ligand is subjected to elemental analyses (C, H, N, S and metal content) andmolar conductance. The results of physical andanalytical data are given in Table 1.
3.2 X-Ray diffraction studies
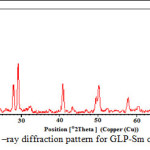
The crystallographic data (scattering angles, d-spacings,and relative intensities) for glipizide with samarium is listed in Table 2 by using computer software (FPSUIT 2.0V) and applying interactive trial and error method keeping in mind the characteristics of the various symmetry system, till a good fit was obtained between the observed and the calculated Sin2θ value. The X-ray diffraction pattern is shown in Fig. 2.It can be seen that the main characteristic scattering peaksfor GLP-Sm complex are found at 15°, 29° 40°and 50° positions which indicate that the complex formed is a well knit one25-26.
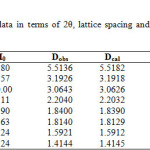 |
Table2: X-ray diffraction data in terms of 2θ, lattice spacing and relative intensities for GLP-Smcomplex.
Click here to View table
|
From the crystallographic data, unit cell parameters are obtained for GLP-Sm complex which attributed to monoclinic crystal system. The particle size of GLP-Sm complexis9.418 microns which is calculated from X-ray line broadening using the Scherrer formula Dhkl=κλ/βhklcosθ, where D is the particle diameter in angstroms, κ is a coefficient and is equal to 0.89 here, β is the half-maximum line width, and λ is the wavelength of X-rays, porosity is 0.0564% calculated by formula

and volume of the unit cell is 14065.752 A° which is calculated by Volume (Å)= abc where a, b and c are lattice parameters. Density = is found 0.0765 gcm-3 respectively. Space group is Pmmm and α=90°, β=90°, γ =89.78°.

3.3 Thermal analyses (TGA and DTA)
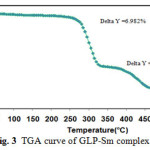
Thermal analyses techniques (TGA and DTA) are useful in both quantitative and qualitative analyses. Sample can be identified and characterized by investigating their thermal behavior. TGA measures weight changes while DTA measures temperature of transitions and reactions.The TGA curve for the SmIIIcomplex represents two decomposition steps within the temperature range of 50-600°C as shown in Fig. 3.The first step of decomposition with in the temperature range from350-400°C (Calcd.Wt. loss:6.46%,found,6.98%) is accompaniedby the loss of water molecules. The second step ofdecompositionwithin the temperature range 450-500°C is 3.49may accounted for organic moiety in the complex.
3.4 Kinetics studies
The Freeman-Carroll and Sharp-Wentworth methods have been employed for the calculation of kinetic parameters of the newly synthesized complex with help of dynamic TG curve.
Freeman-Carroll method27
In this method, activation energy and order of reaction are related to following equation as;
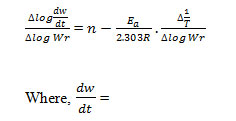
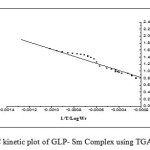
Where rate of change of weight with time and Wr =Wc-W, Wc =Wt. loss at completion of reaction, W = Total wt. loss up to time‘t’, Ea=Energy of activation, n=Order of reaction. The plot


of the term is a straight linewith a slope of(-Ea/2.303R) as shown in Fig. 4. Energy of activation (Ea) is determined from the slope and order of reaction (n) obtained with the help of intercept.
Sharp-Went worth method28
In this method Ea can be evaluated by the following expression
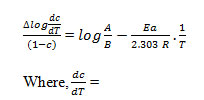

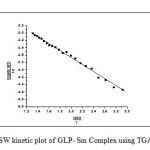
Where Rate of change of fraction of weight with change in temperature. β = Linear heating rate Fig.5 shows a plot of the left-hand side of the aboveequationagainst 1/T gives a slope from which Eawas calculated.
The entropy of activation (ΔS), enthalpy of activation (ΔH) and the free energy change of activation (ΔG) were calculated using the following equations

The calculated values of kinetic parameters such as energy of activation (Ea), enthalpy (ΔH), entropy (ΔS) and free energy change (ΔG)aregiven in Table 3.
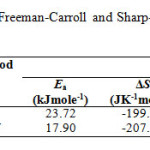 |
Table3: Kinetic parameters using the Freeman-Carroll and Sharp-Wentworth methods for GLP-Sm complex.
Click here to View table
|
According to the kinetic data obtained from DTA curves, Sm (III) complex have negative values of entropy, which indicate thatcomplex have more ordered systems 29. The values of ΔGis found to be positive for the complexwhich revealsthat the free energy of the final residue is higher than that ofthe initial compound and all the decomposition steps are non-spontaneous processes. Positive value of ΔH means that the decomposition processes are endothermic.
Acknowledgement
The authors are thankful to the UGC New Delhi for financial assistance as RGNF and also to the Principal of Crescent College of Technology, Bhopal. Authorsare also thankful to P.U. Chandigarh and IIT Bombay for providing X-Ray and TGA data.
References
- Report of a World Health Organisation Consultation. Definition, Diagnosis, Classification of Diabetes mellitus and its Complications. WHO/NCD/NCS/99.2
- Umathe,S. N., Dixit, P.V.:Biochemical Pharmacology, 75:1670 – 1676 (2008).
CrossRef
- David, R. Williams and Thomas,Lemke,L., Foye’s Principles of Medicinal Chemistry, 5th Ed., Lippincott William and Wilkins, 629 (2005).
- Hardman,J. G.,Limbird,L. E., Goodman and Gilman’s, The Pharmacological Basis of Therapeutics, 11th Ed., McGraw-Hill Co., New York, 1613 (2005)
- RemkoM.:J. Mol. Stru.Theochem, 897 (1-3): 73 (2009).
CrossRef
- MelanderA.:Metabolism, suppl., 1, 36 (2): 12 (1987).
- Pfizer,: Glucotrol XLR Glipizide Extended Release Tablets Prescribing Information, New York, NY, May (2007).
- Ammar,H. O., Salama,H. A., Ghorab,M., El-Nahhas,S. A. and Elmotasem,H.:Curr. Drug Deliv.,3 (3): 333 (2006).
CrossRef
- Dollery,C., Therapeutic Drugs, 2nd Ed., Churchill Livingstone,1:56 (1999).
- Prabhakara,P.,Nayari, M. H.,Gulzar, A. M.,Yadav,B. and Charyulu, N.R.: Indian J. Pharm. Edu. Res., 42 (2): 174 (2008).
- Semalty, M.,SemaltyA. and Kumar,G.:Indian J. Pharm. Sci., 70: 43 (2008).
CrossRef
- Wahlin-Boll, E., Groop, L., Karhumaa, S., Groop, P. H., Totterman, K. J. and Melander, A.:Eur. J. Clin. Pharmcol.,31: 95 (1986).
CrossRef
- Sankalia,J. M., Sankalia,M. G. and Mashru,R. C.:J. Control Release, 129: 49 (2008).
https://doi.org/10.13005/bpj/392
CrossRef
- Massimo, M. B.:ClinTher., 25: 799-816 (2003).
CrossRef
- Kouichi et al.:diab. Res. Clin. Pract.,68: 250-257 (2005).
- Geinsen, K.:Drug Res., 38: 1120-1130 (1988).
- Jose, S. and Iqbal,S. A.:Biomedical & Pharmacology Journal.,6(1): 111-124 (2013).
CrossRef
- Prakash, O., Krishan, B.andJacob, G.:Orient. J. Chem., 29(2):823-828.(2013)
CrossRef
- Job, P.:Annales de Chimie, 10:113 (1928).
- Turner, S. E.and Anderson, R. C.:Journal of the American Chemical Society, 71:912–914 (1949).
CrossRef
- Irving, H.andRossotti, H. S.:J. Chem. Soc., 3397 (1954).
- Irving, H.andRossotti, H. S.:J Chem Soc.,1176 (1955).
- Iqbal,S. A., andZaafarany, I.:Orient. J. Chem., 28(1):613-618(2012).
CrossRef
- Prakash, O., Iqbal,S. A. andJacob, G.:Orient. J. Chem., 29 (3): 1079-1084 (2013).
- Krishan, B., Tawkir, M. and Iqbal,S. A.: Orient. J. Chem., 28(4): 1883-1888 (2012).
CrossRef
- Reddy, H. K., Seshaiah, D. P., and Reddy, A. V.:Orient. J. Chem., 27(3):1125-1131(2011).
- Freeman, E. S.and Carroll, B.: The Journal of Physical Chemistry, 62: 394–397 (1958).
CrossRef
- Sharp, J. H.and Wentworth, S. A.:Analytical Chemistry, 41: 2060– 2062 (1969).
CrossRef
- Ola, A.and El-Gammal.:SpectrochimActaA75:533–542 (2010).
Views: 940
 This work is licensed under a Creative Commons Attribution 4.0 International License.
 Material Science Research India An International Peer Reviewed Research Journal

