Rami A. Omari1 and Gilbert Ayuk2
1Department of physics, Al al-Bayt University, P.O.BOX 130040, Mafraq 25113, Jordan.
2Fulton-Montgomery Community College, 2805 State Highway 67, Johnstown, NY 12095 .
Corresponding author Email: romari@aabu.edu.jo
DOI : http://dx.doi.org/10.13005/msri/140105
Article Publishing History
Article Received on : 8 Feb 2017
Article Accepted on : 15 April 2017
Article Published : 25 Apr 2017
Plagiarism Check: Yes
Article Metrics
ABSTRACT:
The glass transition temperature and the surface dynamics of poly (butyl methacrylate) (PBMA) films have been studied using a phase-modulated ellipsometer equipped with a home-built sample cell with temperature controller. Experiments were performed for a range of temperatures, both above and below the glass transition temperature (Tg). In our study the glass transition temperature was obtained by plotting the ellipticity, as a function of temperature using the data from the ellipsometric cooling scan. the correlation functions governing the fluctuations were calculated at each temperature from the time-dependent fluctuations in film thickness as a function of temperature using ellipsometry data collected at 50 Hz frequency. The results indicate that at temperatures well above Tg, the correlation functions obey a simple exponential decay. However, as Tg is approached, the correlation functions are best fitted with a stretched exponential relation, indicating a broad distribution of relaxation times. In addition, the temperature dependence of surface relaxation process has been found to be much weaker compared to the bulk relaxation.
KEYWORDS:
Correlation function; Ellipsometer; Glass transition temperature; Stretched exponential relation; Thin polymer films;
Copy the following to cite this article:
Omari R. A, Ayuk G. A Study of Supported Poly(N-Butyl Methacrylate) (Pbma) Thin Polymer Films Near The Glass Transition Temperature. Mat.Sci.Res.India;14(1)
|
Copy the following to cite this URL:
Omari R. A, Ayuk G. A Study of Supported Poly(N-Butyl Methacrylate) (Pbma) Thin Polymer Films Near The Glass Transition Temperature. Mat.Sci.Res.India;14(1). Available from: http://www.materialsciencejournal.org/?p=5379
|
Introduction
The increasing technological demand for ever-thinner amorphous polymer films cast onto solid substrates has quickly advanced the study of supported polymer films from a level of fundamental understanding a few years ago, to an applications level. In applications such as semiconductor fabrication, nanostructured polymer systems, polymeric sensors, organic light emitting diodes, microsystems, biomicrosystems, pharmaceuticals, adhesion, lubrication, coatings, electronics packaging, composite materials, information storage, etc.1-2 successful performance depend critically on the details of the thin film behavior. The glass transition remains the most characteristic and important of amorphous glass forming polymers; its understanding of which is crucial for current and future applications and technologies dependent on polymer glasses
The importance of understanding the glass transition in thin polymer films has led to a large number of experimental, theoretical and simulation work. The experiments have consisted of both direct measurements of the glass transition temperature Tg and related mobility of chain and segmental mobility in polymer thin films, and have involved a variety of techniques including ellipsometry, local thermal analysis, x-ray reflectivity, Brillouin light scattering, force microscopy (FM), positron annihilation spectroscopy, quartz crystal microbalance (QCM) and many others. Despite some conflicts, there is general agreement that the glass transition and mobility of thin polymer films deviate frequently and substantially from those of the bulk polymers both because of limited film thickness and interfacial phenomena.3-23
The most commonly studied relaxation property is the structural, or α relaxation, which in most supercooled liquid and polymer systems near Tg shows highly non-exponential dynamics. Studies have reported nanoscopic spatial heterogeneities as a source for these non-exponential relaxation properties.7 Research on the polymer thin film and surfaces near the glass transition so far yielded contradictory results.24-26
Apart from the relative lack of Tg and surface relaxation studies on PBMA, the choice of PBMA in this study is because its bulk Tg is about room temperature(Tg ~ 32 oC), so that we expect to observe interesting changes in the surface relaxations at well-controlled temperatures. Our results indicate that the surface relaxation rate has a much weaker temperature dependence compared to the bulk relaxation. The results of our experiments, as well as those of future studies using our novel approach, should enhance the current state of understanding of the dynamics at the surface of thin liquid and glassy films, and interaction between polymer films and substrates. These findings may also have applied consequences in that they are expected to lead to a better understanding of the mechanics of adhesion of highly viscoelastic surfaces.
Materials and Sample Preparation
Poly(n-butyl methacrylate) (PBMA) (Mw=180 kg/mol and Mw/Mn=1.08 Polysciences Inc) films were prepared by dissolving PBMA in Toluene (C6H5CH3) ((100%) Mallinckrodt Baker, Inc.) and then spin-casting them onto silicon wafers. The silicon wafers had previously been cleaned by etching them in a solution of aqueous hydrofluoric acid for 24 hours, then rinsed with ultra pure water having 18.2 MΩ cm resistivity (Millipore Corp., Billerica, MA), and next air dried in a stream of Argon gas and finally annealed at 110 oC for 24 hrs in a vacuum oven. The etching was necessary to remove the native oxide from the Si surface and to produce a smooth stable surface. Annealing was required to remove any water left after air drying and to ensure all wafers have equivalent thermal history. The polymer solutions were prepared by separately dissolving 100 g of powder PBMA into 100 ml of toluene. Toluene is the preferred solvent because it dissolves the polymers completely and results in film surfaces of even smoothness. A P-6000 spin coater from Specialty Coating Systems Inc. was used to spin cast the PBMA on the Si wafers. The spinner was operated at 3000 rpm for 20 s for each application. The polymer-coated samples were annealed at 110 oC for 24 hrs in a vacuum oven (Fisher Scientific). Annealing of the films was necessary to remove any residual solvent.
Instrumentation and Measurements
To permit for a simultaneous measurement of both the glass transition and the surface dynamics in real time, a phase-modulated ellipsometer (PME) (Beaglehole Instruments, λ = 632.8 nm), whose angle of incidence was fixed near the Brewster angle (~ 75o SiO2 and 67o with film) was incorporated to a model SR 830 digital single processing DSP lock-in amplifier (Stanford Research) that was connected with a data acquisition card (National Instruments). The integration of these additional components was necessary because unlike the dual lock-in amplifier of the Beaglehole ellipsometer that permits data collection rates of order of seconds, the DSP lock-in amplifier allows the film surface to be probed at millisecond timescales. The card permitted the signal from the lock-in amplifier to be recorded at equally spaced time intervals. Other additions to the PME setup include a sample cell, temperature controller and data analysis fully integrated into the ellipsometer software. The temperature control consists of a commercial proportional-integral-derivative (PID) temperature controller (LakeShore Cryotronics, Inc.) and two thermocouples to control both the sample and heater temperatures. The temperature control is fully integrated into the ellipsometer measurement software (adjustable heating rates, time resolved measurements). The sample cell is designed as a closed cell with 2 narrow gaps (~ 5 mm radius) for the ellipsometer light beam.
To measure the surface relaxations and the glass transition temperature Tg, a film sample was placed in a home-built sample cell on the heating stage and phase modulated ellipsometry (He-Ne laser, λ = 632.8 nm, 5 mW) was used in measuring the surface fluctuations and film thickness respectively, continuously as a function of temperature.10 A 1-mm diameter He-Ne laser beam was directed onto the film surface. The angle of incidence of the ellipsometer was held fixed near the Brewster angle through each experiment while for dynamical measurements the analyzer position of the ellipsometer was set so that its fast axis is at angle 45oto the plane of incidence. Prior to doing the temperature and ellipsometricscans, the sample was heated to about 30 oC above its bulk Tg value (~ 32oC for PBMA) and maintained at this high value for about 15 – 20 mins. A suitable measurement position on the film was found by doing a trial autocorrelation scan at the maximum film temperature. The fitting of the calculated autocorrelation data to an exponential (β ~ 1) meant the film was relaxing appropriately and the position was good enough for measurements. The trail run was equally necessary to provide us an idea of the time scale at which the film surface was relaxing. For best results the film should neither be relaxing too fast nor too slow. A reasonable time scale was obtained by doing scans at appropriate frequency and run time.
The thermal induced fluctuations at the film surface were measured with the integrated lock-in amplifier used in place of the Beaglehole dual lock-in amplifier. The lock-in time constant and sensitivity were set at 300 μs and 100 mV respectively while the data was collected at a frequency of 50 Hz. At a given temperature step samples were held at a constant temperature for 4 hrs for thermal equilibration after which the Surface fluctuations were measured for 60 mins. 100,000 data points were measured at each temperature step and this took 2000 sec. Film temperature was changed at 2 oC steps. The analysis software package (LabVIEW National Instruments) enables a simplified analysis and presentation of the multiple data files of the temperature scans.
To determine the film thickness as a function of temperature, an ellipsometricscan was performed using the Beaglehole ellipsometer and its dual lock-in amplifier as the sample was slowly cooled at a temperature ramp rate of |dT/dt| = 0.5 K/min down to a temperature of 25oC for PBMA a. The slower ramp rate allowed more data points to be collected during a temperature ramp. The collection of more data points would especially be important in later studies on thinner films to compensate for the lower signal to noise ratio. The Beaglehole dual lock-in amplifier time constant and sensitivity were set at 1 sec and 500 mV respectively. The ellipticity was measured with sensitivity of » 5 x 10⁻⁵. To first order, is proportional to change in film thickness. The temperature was measured inside the sample cell and data were corrected for the temperature difference between the sample cell and the film surface. Throughout each experiment the sample temperature was controlled to within 0.50 mK using a commercial PID temperature controller (Lakeshore).
Results
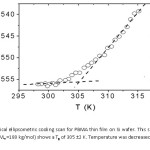
The ellipticity, – temperature data from the ellipsometricscans and the raw (for autocorrelation) data from the temperature scans were next analyzed to determine the Tg and the surface relaxations of the film. The glass transition temperature was obtained by plotting the ellipticity, as a function of temperature10 using the data from the ellipsometric cooling scan. For each measurement, the film was first raised to a temperature well above the glass transition temperature to completely melt the film. As noted in chapter 2 the ellipticity, is essentially linear with thickness (h) in the studied thickness range; thus the point at which the two straight-line segments intersect marks the glass transition temperature of the film; 305±2 K for PBMA (Fig. 1). The temperature range of each line segment for the estimation of glassy state and rubbery state was 298 – 302 K and 308 – 315 K .
Figure 1: Typical ellipsometric cooling scan for PBMA thin film on Si wafer. This sample ~ 0.3 μm thick (Mw =180 kg/mol) shows a Tg of 305 ±2 K. Temperature was decreased at a rate of 0.5 K/min.
Autocorrelation analysis was done on the raw data from the ellipsometry temperature scans to obtain correlation functions that provide dynamic information about the film. The raw data comprised of scaled voltages and times representing the time-dependent fluctuations in the film thickness. Autocorrelation functions governing the fluctuations were determined at each temperature during discrete cooling steps.
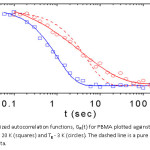
Figure 2 shows a logarithmic plot of the normalized autocorrelation functions, GN(t) for PBMA against time (t) for two different temperatures.
Figure 2: Normalized autocorrelation functions, GN(t) for PBMA plotted against logarithmic time log (t) for Tg + 20 K (squares) and Tg – 3 K (circles). The dashed line is a pure exponential fit of the Tg – 3 K data.
The squares corresponding to a temperatures of Tg + 20 K, fits well with a pure exponential decay of time constant t = 1.02 ± 0.04 s. This temperature is representative of all temperatures well above Tg, for which we found a single time constant associated with the equilibrium thickness fluctuations. The calculated autocorrelation data (circles) at a temperature of Tg – 3 K, are best fitted to the Kohlrausch–Williams–Watts (KWW) ‘stretched exponential’ function (solid line): G(t) » exp [-(t/τ)β] with t = 3.69 ± 0.54 s, and stretching parameter β = 0.48 ± 0.05. This result too was representative of all others obtained at temperatures close to and below Tg. The parameter β determines the width of the relaxation spectrum; a β far smaller than one implies a broader spectrum. The dashed line in Fig. 2 was obtained by fitting the calculated autocorrelation data at Tg – 3 K to a pure exponential (β =1).
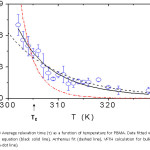
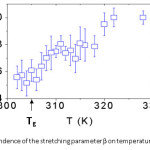
Combining the β and τ parameters obtained from KWW fitting leads to a weighted average correlation time, ∫G(t)dt = t/βΓ(1/β) Figures 3 and 4 show plots of and β as a function of temperature for PBMA. The data have been fitted with the Vogel-Fulcher-Tammann-Hesse (VFTH) equation: t = t0 exp (B/T-T0) (black solid line, To = 226 ± 2 K) and an Arrhenius fit (dashed line) with activation energy, EA = 71 ± 6 kJ/mol for all temperatures. The VFTH calculation for bulk PBMA (dash-dot line)27 (B = 834 K, To = 256 K) is shown for comparison. The error bars were obtained by taking the standard deviation from 8 different measurements.
Figure 3: Average relaxation time áτñ as a function of temperature for PBMA. Data fitted with the VFTH equation (black solid line), Arrhenius fit (dashed line), VFTH calculation for bulk PBMA (dash-dot line).
Figure 4: Dependence of the stretching parameter β on temperature for PBMA.
Discussion and Conclusion
The two straight line segments in Figure 1 represent regions of nearly constant expansivity α = (1/h)(Δh/ΔT). The near discontinuity in the expansivity α at T = Tg produces a ‘kink’ in h(T). It is the temperature that this kink occurs that we identify as the glass transition temperature Tg. The change in film thickness with temperature is, to within experimental uncertainty, linear for temperatures both below and above Tg, as is expected on the basis of thermal expansion. Our measured Tg values for both PBMA are close to its respective bulk value and as expected for thin films. Previous studies on Polystyrene (PS) thin films on Si substrates had shown that the surface Tg is generally decreased compared to bulk for films with thickness less than 200 nm and that for thick films the surface Tg is close to or equal to the bulk value [8]. This decrease in the surface Tg for thin films has been attributed to the presence of a liquid-like layer, at least several nanometers (and perhaps more than 10 nm), on the surface of glassy polymer films. Typically it is necessary to cool 20 oC to 30 oC below Tg to obtain a sufficiently large data set in the glassy regime. This was, however, not possible with our setup for the case of PBMA.
The results in Fig. 3 agree with previous studies.7,13 Far above the Tg of PBMA all processes relax exponentially at the same rate (single relaxation time). The β value of 0.48 ± 0.05 indicates a broader spectrum of relaxation times for temperatures close to and below Tg. The parameter β determines the width of the relaxation spectrum. This result shows that close to and below Tg the correlation and relaxation functions become increasingly nonexponential. This nonexponential relaxation has been explained by Ediger7 by assuming that the measurement position at which the laser beam is incident is heterogeneous such that the relaxation in a given environment might be nearly exponential, with the relaxation time varying significantly among environments.
In Figs. 3 and 4 we present the dependence of (τñ and β on temperature for PBMA. The average correlation time increases by approximately an order of magnitude from Tg + 20 K to Tg – 3 K and the observed dynamics becomes increasingly non-exponential with decreasing temperature. This dramatic difference in the dynamics (timescale) between the fastest and slowest regions at Tg is consistent with Ediger’s experiments [7] on the dynamics of supercooled liquids. It is equally clear from Fig. 3 that the surface relaxation time has much weaker temperature dependence than the bulk.
Our data was fitted well with the VFTH equation with B at its bulk value, To = 226 K for PBMA. This represents a shift of DTo » -30 K for PBMA . This shift is probably due to the fact that the fluctuations in our experiments are governed by the properties of the region close to the free surface. Chain segments near the surface can have a different structural relaxation mechanism due to higher motional freedom, which may not follow the VFTH type law. The VHTH assumes that the motion of the chain monomers occurs in the interior of the film. This shift in DTo is identified as the reduction of the glass transition temperature for the free surface layer of the polymer films as probed by ellipsometry. This is in qualitative agreement with the depression in Tg observed in ultrathin films as reported in other studies.8,16
The deduced activation energies (EA) from the Arrhenius fits- EA» 71 kJ/mol for PBMA are smaller compared to the bulk value as reported in the literature. These lower values for the activation energy in experiments on thin films are expected because of the availability of the extra free volume at the surface. These values are close to those of the secondary β-relaxation processes for supported PBMA, an indication that the fluctuations measured in these experiments may originate from the secondary relaxation processes in polymers. Secondary relaxations come from the motion of smaller parts of the chain, which requires much lower activation energy (EA»70-80 kJ/mol) than α-relaxation.27
In conclusion, our experiments with phase modulated ellipsometry have enabled us to measure the glass transition temperature of PBMA films in conjunction with the time- dependent relaxation time for the very near surface regions (2 to 4 nm) of the films. The resulting relaxation times for both PBMA displayed weaker temperature dependence than the bulk relaxations for all temperatures.
References
- Niu Y. H., Hou Q.,Cao Y. Appl. Phys. Lett. 2002;81:634.
CrossRef
- Yoshimoto K., et al., J. Chem. Phys. 2005;122:144712.
CrossRef
- Xenopoulos A., Wunderlich B. J. Polymer Sc. B. 1990;28:2271.
CrossRef
- Edigar M. D.,et al., J. Chem. Phys. 2006;124:184501.
CrossRef
- Best A.,et al. Macromolecules. 2005;38:4539.
CrossRef
- Ellison C. J., Torkelson J. M. Nat. Mater. 2003;2:695.
CrossRef
- Ediger M. D. Annu. Rev. Phys. Chem. 2000;51:99.
CrossRef
- Keddie J. L., Jones R. A. L and Cory R. A. Europhys. Lett. 1994;27:59.
CrossRef
- Roth C. B and Dutcher J. R. J. Electroanal. Chem. 2005;584:13.
CrossRef
- Kawana S., Jones R. A. L. Phys. Rev. E. 2001;63:021501.
CrossRef
- Keddie J. L., Jones R. A. L and Cory R. A. Faraday Discuss. 1994;98:219.
CrossRef
- van Zanten J. H., Wallace W. E and Wu W. L. Phys. Rev. E. 1996;53:R2053.
CrossRef
- Fakhraai Z and Forrest J. A. Science. 2008;319:600.
CrossRef
- Forrest J. A., Dalnoki-Veress K., Dutcher J. R. Phys Rev. E. 1997;56:5705.
CrossRef
- Forrest J. A., Dalnoki-Veress K.,Stevens J. R., Dutcher J. R. Phys Rev. Lett. 2002;77:1996.
- Dalnoki-Veress K., Forrest J. A., Murray C., Gigault C., Dutcher J. R. Phys Rev. E. 2001;63:031801.
CrossRef
- Mansfield K. F and Theodorou D. N. Macromolecules. 1991;24:6283.
CrossRef
- de Gennes P. G. Eur Phys. J. E. 2000;2:201.
CrossRef
- Mattson J., Forrest J. A and Borjsson L. Phys. Rev. E. 2000;62:5187.
CrossRef
- Forrest J. A and Mattson J. Phys. Rev. E. 2000;61,R53.
CrossRef
- Kajiyama T., Tanaka K., Takahara A. Macromolecules. 1997;30:280.
CrossRef
- Tanaka K., Takahara A., Kajiyama T. Macromolecules. 2000;33:7588.
CrossRef
- Overney R. M.,et al., Phys. Rev. Lett. 2000;85:2340.
CrossRef
- Sharp J. S and Forrest J. A. Phys. Rev. Lett. 2003;91:235701.
CrossRef
- Ge S.,et al., Phys. Rev. Lett. 2000;85:2340.
CrossRef
- Li C., et al., Macromolecules. 2005;38:5144.
CrossRef
- Schröter K.,et al., J. Non-Cryst. Solids. 2007;353.
Views: 1,968
 This work is licensed under a Creative Commons Attribution 4.0 International License.
 Material Science Research India An International Peer Reviewed Research Journal


