Introduction
Acinetobacter
(Gram-negative) is a
genus of microorganisms belonging to the proteobacteria family, whose
species are found in a wide variety of environments1. The bacteria extensively spread
in hospitals where they offer the risk of transmitting resistance to other
pathogens2. Most of the bacterial infections
are commonly caused by Staphylococci and it is considered
to be the most important source of bacterial diseases found in more than one
million patients each year globally3,4. Staphylococcus epidermidis is
the best known gram-positive bacterium, normally observed on human skin, and
mucous membranes.Itis a frequent source of infections involving
indwelling surgical and medical devices in patients having an impaired immune
system5. It generates a biofilm to defend itself from the host immune system
and increase its resistance to antibiotic medicines6. Antibiotic
resistance is a serious issue throughout the world and develops an urgency to
discover an efficient drug for S. epidermidis bacterial
infections. Literature survey shows benzimidazole derivatives are used as
a potential drug against S. epidermidis bacterial infections7-9.
Since the growth in antibacterial resistance is expected to develop by S. epidermidis,we are on a hunt to study more benzimidazole derivatives for the cure of bacterial infections. Thus, in view of the wide ranging application of benzimidazole-2-thione core10,11, in silico studies (DFT and HS) on the known crystal structures of 5-Methoxy-1H-benzo[d]imidazole-2(3H)-thione (M1: CSD refcode WIGYOB)12 and 4, 5- Dimethylbenzimidazolene-2-thione (M2: CSD refcode SINZIY)13, having close chemical similarity, have been carried out for the computation of their optimized geometry and electronic properties. Both the structures have been optimized by using Gaussian 09 program14, while the electrostatic potential maps have been analyzed by using Crystal Explorer 21.5 program15, followed by lattice energy frameworks to measure the stability of both molecules toward crystal packing. For the in silico antibacterial activity of these two imidazole derivatives to be an effective lead compounds in S. epidermidis bacterial treatments, the Molecular docking analysis has been made using the crystallographic structure of Staphylococcus epidermidisTcaR protein (PDB ID : 4EJV) to identify the antibacterial inhibition of both imidazole compounds. The protein (PDB ID: 4EJV) is staphylococcus epidermis TcaR, in complex with chloramphenicol. The S. epidermidis is known to develop a biofilm to guard itself from host immune system and enrich their resistance to antibiotic drugs, for more than 60% of the bacterial infections are reportedly produced by the creation of biofilm.The main component involved in the formation of biofilm in S. epidermidis is polysaccharide intercellular adhesin (PIA)16, the production of PIA depends on the expression of the icaADBC gene and current studies revealed that TcaR acts as a regulatory factor to affect the transcription of icaADBC17. TcaR is a MarR family transcription regulator that is involved in teicoplanin and methicillin resistance.Therefore, it was originally described as a putative transcriptional regulator of the teicoplanin-associated locus (tca). Because of the above reasons we have chosen the Staphylococcus epidermidisTcaR protein (PDB ID: 4EJV) for the present research work. Also from literature survey we came to know that benzimidazole derivatives are good inhibitors of S. epidermidis and hence motivated to dock both ligands into the Staphylococcus epidermidis TcaR protein.The molecular docking outcome shows that both imidazole derivatives M1 and M2 are well bound with the active site amino acids of S. epidermidis receptor, compared to the heteroatom chloramphenicol found in 4EJV.
Computational Details
Quantum chemical
calculation
The chemical structure of M1 and M2 is shown in Figure 1. The theoretical calculations were performed with DFT methods using Gaussian 0914 and visualized through Gauss view 6.0.1618. Both structures were optimized using B3LYP/6-311+G(d,p) level basic set without any symmetrical constraints. Further, the optimized structural parameters were used to calculate the molecular geometry, atomic charges, molecular electrostatic potential map, HOMO-LUMO energy gap and related reactive parameters (electronegativity, chemical potential, hardness, softness, electrophilicity).
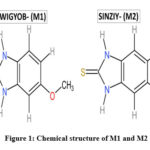 |
Figure 1: Chemical structures of 5-Methoxy-1H-benzo[d]imidazole-2(3H)-thione(M1) and 4, 5- Dimethylbenzimidazolene-2-thione (M2)
Click here to View figure
|
Hirshfeld surface (HS)
Hirshfeld surface (HS) and its associated two-dimension (2D) fingerprints plots for M1 and M2 have been constructed using crystallographic information file (CIF), to dissect molecular structures into non-covalent contacts19-21. High resolution Hirshfeld surface for M1 and M2 were generated using Crystal Explorer 21.515, and functions of curvature and distance, including shape index and normal contact distance (dnorm), were mapped onto the surfaces19,21,22.
In 2D fingerprint plots,
the combination of di (distance from point to the nearest atom
internal to the surface) and de (distance from point to the nearest atom external to the surface) provides a
summary of intermolecular contacts within both the molecular structures23-26. The position of
voids in both the structures has been visualized by constructing (0.002
au)-isosurface of procrystal electron density, which contain more than 98% of
the electronic charge of the molecules and is used to identify the empty space
in crystal by computing the shape and size of molecules27.
Energy framework
For the energy-frameworks
analysis, the CIF was used as input to Crystal Explorer 21.5 software15 and molecular pair-wise
interaction energy of both the structures was
estimated from a single-point molecular wavefunction at B3LYP/6-31G (d, p) level of
theory. The calculations were performed
by generating a cluster of radius 3.8 Å around
the central molecule. The total interaction energy between the pair-wise
molecules is the sum of electrostatic energy (Eele), repulsion energy (Erep),
polarization energy (Epol) and dispersion energy (Edis).
Further the strength of each energy component is represented by the width of
its cylinders28,29.
Molecular Docking
The crystallographic structure of Staphylococcus epidermidis TcaR30 was obtained from the RCSB Protein Data Bank server (PDB ID: 4EJV) which consists of 151 aminoacids with resolution of 2.9Å. The protein is a member of the Multiple Antibiotic Resistance Regulator (MarR) family of transcriptional regulators, named by Escherichia coli MarR. The protein preparation for the docking procedure was carried using Auto Dock 4.231, following the standard protocol32. The hetero atoms, water molecules and other cofactors attached with the receptor were removed and polar hydrogens were added and PDBQT format file was saved. The active sites coordinated were found from the position of native ligand chloramphenicol (X= -14.939; Y= -39.3618; Z= -2.9430). Similarly, all the ligand PDBQT files were prepared and saved. The saved files were used in the Auto Dock Vina 1.1.2 software for molecular docking investigations33. The docked poses were viewed by Discovery Studio Visualizer34 and best complexes were selected.
Result and Discussion
Molecular geometry
analysis
The unit cell parameters for (M1) and (M2) are: a = 7.4922(8) Å, b = 7.6532(2) Å, c = 8.8403 (9) Å, V = 393.47(9) Å3 Z = 2, and a = 5.3410(4) Å, b = 8.3421(7) Å, c = 10.5205(9) Å, V = 373.4(2) Å3 Z = 2, respectively. The atomic numbering scheme and optimized structure for M1 and M2 are shown in Figure 2. Table 1 summarizes their experimental and optimized geometrical parameters (bond lengths and angles) at B3LYP/6-311+G(d,p) level basic set. The optimized parameters show a relative proximity with the reported experimental data (Table 1). The maximum deviation between the optimized and experimental bond length N1-C7 and N2-C7 by B3LYP is about 0.023 Å (M1), whereas that of N1-C7 is about 0.093 Å in (M2). The S-C7 distance as obtained from the optimized structure in case of M1 and M2 are comparable with their analogous structures9. There exists a π-π interaction between the homo-aromatic rings of the molecule M1 with centroids distance of 3.658 Å(along the symmetry code (1-x, 1-y, 1-z),as illustrated in Figure 3 [Mercury]35).
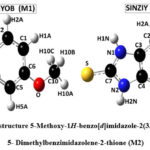 |
Figure 2: Optimized structures of 5-Methoxy-1H-benzo[d]imidazole-2(3H)-thione (M1) and 4, 5- Dimethylbenzimidazolene-2-thione (M2)
Click here to View figure
|
Table 1: Comparison ofall experimental and calculated bond length (Å) and angles (o) of M1and (M2) using DFT method with 311+G(d,p) basic set
|
WIGYOB (M1)
Bond length (Å) X-Ray DFT/6-311+G(d, p)
|
SINZIY (M2)
Bond length (Å) X-Ray DFT/6-311+G(d, p)
|
|
C1-C2
|
1.383
|
1.401
|
C1-C2
|
1.316
|
1.400
|
|
C2-C3
|
1.378
|
1.383
|
C2-C3
|
1.418
|
1.388
|
|
C3-C4
|
1.392
|
1.408
|
C3-C4
|
1.397
|
1.401
|
|
C4-C5
|
1.383
|
1.383
|
C4-C5
|
1.372
|
1.388
|
|
C5-C6
|
1.385
|
1.403
|
C5-C6
|
1.437
|
1.400
|
|
C6-C1
|
1.392
|
1.402
|
C6-C1
|
1.422
|
1.416
|
|
S-C7
|
1.677
|
1.665
|
S-C7
|
1.696
|
1.666
|
|
N1-C7
|
1.350
|
1.373
|
N1-C7
|
1.283
|
1.376
|
|
N1-C3
|
1.390
|
1.394
|
N1-C3
|
1.433
|
1.391
|
|
N2-C7
|
1.356
|
1.379
|
N2-C7
|
1.424
|
1.376
|
|
N2-C4
|
1.386
|
1.389
|
N2-C4
|
1.345
|
1.391
|
|
C6-O
|
1.379
|
1.366
|
C1-C8
|
1.557
|
1.510
|
|
O-C10
|
1.426
|
1.421
|
C6-C9
|
1.492
|
1.510
|
|
Bond Angle (°)
|
|
|
Bond Angle (°)
|
|
|
|
C6-C1-C2
|
120.86
|
120.84
|
C6-C1-C2
|
122.03
|
120.27
|
|
C1-C2-C3
|
117.78
|
118.18
|
C1-C2-C3
|
118.50
|
118.81
|
|
C2-C3-C4
|
120.73
|
120.68
|
C2-C3-C4
|
121.70
|
120.92
|
|
C3-C4-C5
|
122.33
|
121.82
|
C3-C4-C5
|
120.04
|
120.92
|
|
C4-C5-C6
|
116.19
|
117.44
|
C4-C5-C6
|
118.17
|
118.81
|
|
C5-C6-C1
|
122.04
|
121.04
|
C5-C6-C1
|
119.19
|
120.27
|
|
S-C7-N1
|
126.45
|
127.86
|
S-C7-N1
|
129.17
|
127.71
|
|
S-C7-N2
|
127.13
|
127.47
|
S-C7-N2
|
123.92
|
127.70
|
|
N2-C7-N1
|
106.42
|
104.67
|
N2-C7-N1
|
106.89
|
104.59
|
|
C7-N1-C3
|
110.51
|
111.54
|
C7-N1-C3
|
110.80
|
111.51
|
|
N1-C3-C4
|
106.27
|
106.09
|
N1-C3-C4
|
105.40
|
106.19
|
|
C3-C4-N2
|
106.14
|
106.06
|
C3-C4-N2
|
107.10
|
106.19
|
|
C4-N2-C7
|
110.65
|
111.62
|
C4-N2-C7
|
109.72
|
111.51
|
|
O-C6-C1
|
122.34
|
124.08
|
C8-C1-C2
|
118.21
|
119.30
|
|
O-C6-C5
|
115.60
|
114.89
|
C8-C1-C6
|
119.30
|
120.46
|
|
C10-O-C6
|
117.05
|
118.80
|
C9-C6-C1
|
121.88
|
120.43
|
| |
|
|
C9-C6-C5
|
118.68
|
119.30
|
Atomic charges
Mulliken atomic charges for M1 and M2 were computed at B3LYP methods with 6-311+G(d,p) level basic set as illustrated in Figure 4. The atomic charges have been obtained by the Mulliken population analysis36 and the analysis reveals that all carbon atoms except C2, C5, C6, and C10 have a positive charge (for M1), while in molecule M2, the carbon atoms C1, C3, C4, C6, and C7 have a positive charge while the rest carbon atoms have a negative charge. However, C4 atom in M1 and the C3 and C4 atom in M2 possess high positive charge, rendering these atoms as having electropositive character. All H-atoms exhibit positive charges in both the structures. Moreover, the nitrogen atoms present in both molecules posses negative charge value of -0.21e which results in the formation (N-H…S and N-H…O in M1 and N-H…S in M2) intermolecular hydrogen bonding interaction (Figure 4).
Molecular electrostatic potential
Molecular electrostatic potential (MEP) contour maps, determine the electron density at a point in space around the molecule to identify the sites for nucleophilic and electrophilic reactions. Figure 5 depicted the contour maps of MSP of compounds M1 and M2. Different colors in the contour maps represent different value of electrostatic potential. It is generally accepted that the negative region (red) of MEP indicates electrophilic reactivity and positive region (blue) corresponds to nucleophilic reactivity whereas the green colors indicate the neutral potential. The different colors: red, orange, yellow, green and blue in contour map (Figure 5) represent the increasing order ofelectrostatic potential in terms of electron density. From the contour map of MEP (Figure 5) the negative region dispersed on the oxygen atom of molecule M1 and sulphur atom in both molecules depicted the electrophilic reactivity (red color) whereas N1 and N2 atoms of both molecules depicted nucleophilic reactivity represent by the blue color range.
Frontier molecular orbital
analysis
The analysis of frontier molecular orbital i.e. HOMO (highest occupied molecular orbital) and LUMO (least unoccupied molecular orbital) helps to study the electronic, thermal and chemical properties of the compounds37. The HOMO describes the ability to donate an electron while the LUMO has an ability to gain an electron. The HOMO-LUMO gap explains the charge transfer interaction’s ability within the molecule38,39. Figure 6 represents the HOMO-LUMO energies plot of (M1) and (M2). The positive phase indicated by red color, while negative by green as shown in Figure 6. The HOMO-LUMO energy gaps are about 4.40 eV (M1) and 4.39 eV (M2), respectively, which show that the energy gap of M2 is slightly smaller than that of M1. Theoretical values of HOMO-LUMO and their energy gap in electron-volt help in computing the stability, softness, hardness, electronegativity, chemical potential and electrophilicity index by using Koopman’s theorem40. Table 2 contains the quantum chemical parameters of both the structures.
Table 2: HUMO-LUMO energies and quantum-chemical parameters (eV) for M1 and M2
|
Parameters
|
WIGYOB (M1)
|
SINZIY (M2)
|
|
HOMO energy: EH
|
-5.59
|
-5.49
|
|
LUMO energy: EL
|
-1.19
|
-1.10
|
|
Energy gap: Eg= |EH – EL|
|
4.40
|
4.39
|
|
Chemical hardness ɳ = |EH – EL|/2
|
2.200
|
2.195
|
|
Softness ζ = 1/2 ɳ
|
1.100
|
1.0975
|
|
Electrophilicity index ω = μ2/2 ɳ
|
2.619
|
2.4731
|
|
Chemical Potential μ = (EH + EL/2)
|
-3.39
|
-3.295
|
|
Electronegativity χ = – μ
|
3.39
|
3.295
|
Hirshfeld surface and
crystal voids analysis
Hirshfeld surface (HS) analysis is an effective method for gaining further insight into crystal structure by color-coding long (blue) and short (red) interactions41-43. Figure 7 illustrates the HS of M1 and M2 mapped over dnorm surface. In dnorm surface the deep red spots on the front and back view (Figure 7) represent the strong hydrogen bonding. Four circular deep red spots in dnorm surface of M1 and M2 are due to N-H…S and N-H…O (N1-H1N…S, N2-H2N…S, N1-H1N…O for M1) and N-H…S (N1-H1N…S, N1-H2N…S for M2) whereas the other faint red spots are due to weak interactions. Consequently the intensity of color signifies the intensity of interaction. Figure 8 and 9, respectively, illustrates the shape index contour surface and curvedness plot of M1 and M2. Shape index (Figure 8) is a dimensionless surface property which is used to identify the complementary red-hollows and blue-bumps pairs in maps where surfaces of molecules joined each other44. The π-π interaction in the shape index map of M1 occur between the homo-aromatic rings [symmetry code (1-x, 1-y, 1-z)], visualized by the complementary red and blue triangles (marked in the rectangle, Figure 8). The topography of curvedness maps (Figure9) is a function of the root-mean-square curvature of the surface where low value of curvedness region is relative flat area separated by dark blue boundaries (large curvedness), tends to divide the surfaces into patches related with intermolecular contacts45.The large flat green region along the surface indicates the existence of π-π stacking in the structure of M1 (Figure 9) while this feature is absent in M2.
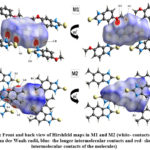 |
Figure 7: Front and back view of Hirshfeld maps in M1 and M2 (white- contacts around the van der Waals radii, blue- the longer intermolecular contacts and red- shorter intermolecular contacts of the molecules)
Click here to View figure
|
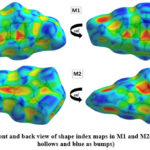 |
Figure 8: Front and back view of shape index maps in M1 and M2(red indicates
hollows and blue as bumps)
Click here to View figure
|
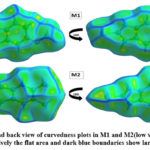 |
Figure 9: Front and back view of curvedness plots in M1 and M2(low value of curvedness region is relatively the flat area and dark blue boundaries show large curvedness)
Click here to View figure
|
Figure 10 and 11, respectively, shows 2D fingerprint plots for M1 and M2 structure and their contribution in terms of various interactions. The H…S/S…H and H…O/O…H contacts in M1, which are ascribed to N-H…S and N-H…O hydrogen bonding interactions, emerge as two strong symmetrical spikes (Figure 10). The H…S/S…H and H…O/O…H contacts in M1 which provide considerable contributions of 24.2 % and 7.1 %, respectively, to the total HS, exhibit strong hydrogen bond interactions with minimum (di + de) values of 2.43 Å and 2.15 Å, respectively. There is one prominent symmetrical spike in the fingerprint map of M2 emerges owing to H…S/S…H contacts (25.4 %, Figure 11) and it is attributed to the existence of a strong (S-H…N) hydrogen bond interaction with minimum (di + de) value of 2.50 Å. However, the H…H contacts in M1 and M2 accounts for 40% and 46.2% of the total HS area, respectively. Apart from this , all other interactions of M1 and M2 are depicted in donut chart inserted in Figure 10 and 11, respectively.
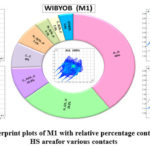 |
Figure 10: Fingerprint plots of M1 with relative percentage contributions to the HS areafor various contacts
Click here to View figure
|
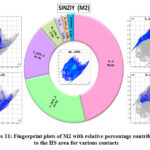 |
Figure 11: Fingerprint plots of M2 with relative percentage contributions to the HS area for various contacts
Click here to View figure
|
The Crystal Explorer 21.5 software15 has been used to calculate the crystal voids contained in both structures, based on the electron density of the procrystal (0.002 au)-isosurface46-49. Figure 12 depicts the volumes, surface areas, and percentage of voids in both the crystal structures. The S-H…N and N-H…O hydrogen bonds are responsible for the crystal packing of M1 with void volume: 14.31 Å3 and surface area: 85.18 Å2, whereas S-H…N hydrogen bonds are responsible for crystal packing of M2 with void volume: 60.12 Å3 and surface area: 141.60 Å2. The voids in both the structures appear to have occupied 0.36 % and 16.10 % of their respective unit cell volume. The difference in crystal voids implies that the interaction energy of M1 is larger than M2 meaning there by that the lattice energy of M1>M2.
Energy frameworks
analysis
The precise interaction energies of M1 and M2 as computed using B3LYP/6-31G(d,p) molecular wave function and their resultant topology is shown using energy frameworks. To construct the energy framework for B3LYP/6-31G(d,p) electron densities, the scale factors for both structures are K_ele (1,057), K_pol (0,740), K_disp (0,871), K_rep (0,618), respectively. Electrostatics (E_ele), polarisation (E_pol), dispersion (E_dis), and repulsion (E_rep) components of interactions between different molecular pairs are given in Table 3 and 4, respectively. The net interaction energy (E_tot) in case of M1 is -231.1 kJ/mol (E_ele = -169.6 kJ/mol, E_pol = -45.5 kJ/mol, E_dis = -200.9 kJ/mol, and E_rep= 253.6 kJ/mol), while it is -118.9 kJ/mol (E_ele = -91.5 kJ/mol, E_pol = -28.6 kJ/mol, E_dis = -104.2 kJ/mol and E_rep= 144.9 kJ/mol) in case of M2. The (ETotal)M1> (ETotal)M2 is primarily due to the difference in their dispersion energies. The graphical visualization of the above energy values for M1 and M2 along the z-axis is shown in Figure 13. To expand or contract the cylinders in the energy framework, a scale factor is applied to each cylinder’s size based on the relative strength of molecular packing in the different directions (Figure 13). Minor interactions below 5kJ/mol were ignored in order to avoid the crowding in the figures.
Table 3: Molecular pairs and the interaction energies (kJ/mol) of molecule M1
|
N
|
Symop
|
R
|
Electron Density
|
E_ele
|
E_pol
|
E_dis
|
E_rep
|
E_tot
|
|
2
|
x, y, z
|
9.12
|
B3LYP/6-31G(d,p)
|
-3.8
|
-2.2
|
-6.4
|
4.2
|
-8.6
|
|
1
|
-x, -y, -z
|
8.82
|
B3LYP/6-31G(d,p)
|
4.4
|
-1.5
|
-15.6
|
8.9
|
-4.6
|
|
2
|
x, y, z
|
11.66
|
B3LYP/6-31G(d,p)
|
-5.0
|
-1.0
|
-2.3
|
1.1
|
-7.3
|
|
2
|
x, y, z
|
7.65
|
B3LYP/6-31G(d,p)
|
-30.8
|
-7.7
|
-17.7
|
36.4
|
-31.1
|
|
1
|
-x, -y, -z
|
6.16
|
B3LYP/6-31G(d,p)
|
-15.5
|
-5.2
|
-18.0
|
17.3
|
-25.2
|
|
1
|
-x, -y, -z
|
4.07
|
B3LYP/6-31G(d,p)
|
-14.5
|
-3.1
|
-54.8
|
37.1
|
-42.4
|
|
1
|
-x, -y, -z
|
3.82
|
B3LYP/6-31G(d,p)
|
-23.8
|
-5.9
|
-46.5
|
41.0
|
-44.7
|
|
1
|
-x, -y, -z
|
6.93
|
B3LYP/6-31G(d,p)
|
2.7
|
-1.0
|
-21.4
|
9.5
|
-10.6
|
|
1
|
-x, -y, -z
|
7.39
|
B3LYP/6-31G(d,p)
|
-85.6
|
-17.5
|
-14.7
|
98.1
|
-55.6
|
|
1
|
-x, -y, -z
|
13.15
|
B3LYP/6-31G(d,p)
|
2.3
|
-0.4
|
-3.5
|
0.0
|
-1.0
|
Table 4: Molecular pairs and the interaction energies (kJ/mol) of molecule M2
|
N
|
Symop
|
R
|
Electron Density
|
E_ele
|
E_pol
|
E_dis
|
E_rep
|
E_tot
|
|
2
|
x, y, z
|
5.34
|
B3LYP/6-31G(d,p)
|
-1.5
|
-4.2
|
-37.6
|
26.1
|
-21.3
|
|
2
|
-x, y+1/2, -z
|
5.36
|
B3LYP/6-31G(d,p)
|
-16.8
|
-7.2
|
-26.6
|
21.5
|
-33.0
|
|
2
|
x, y, z
|
8.34
|
B3LYP/6-31G(d,p)
|
6.1
|
-0.5
|
-2.5
|
0.1
|
4.1
|
|
2
|
-x, y+1/2, -z
|
11.30
|
B3LYP/6-31G(d,p)
|
0.6
|
-0.2
|
-7.7
|
5.0
|
-3.1
|
|
2
|
-x, y+1/2, -z
|
7.40
|
B3LYP/6-31G(d,p)
|
-78.7
|
-15.9
|
-14.5
|
80.9
|
-57.6
|
|
2
|
-x, y+1/2, -z
|
8.47
|
B3LYP/6-31G(d,p)
|
-1.2
|
-0.6
|
-15.3
|
11.3
|
-8.0
|
Molecular Docking analysis
The prepared protein molecule and imidazole derivatives M1, M2 and native ligand chloramphenicol were given as input to the AutoDock Vina program for molecular docking analysis. During the docking procedures, nine conformers of ligand and receptor molecule complexes were generated for each ligand. The best ligand-protein complex conformation was chosen by lower binding energy and hydrogen bond interactions for further analysis in Discovery studio visualizer. The best docked complex poses of M1, M2 and chloramphenicol with 4EJV protein are illustrated in Figure 14-16, respectively.
Results obtained from the docking analysis reveal that M1 and M2 possesses a strong inhibitory nature towards Staphylococcus epidermidisTcaR protein, with binding energy of -10.2 kcal/mol and -9.4 kcal/mol, respectively, as compared to the standard drug chloramphenicol (binding energy, -9.1 kcal/mol). The M1 forms five hydrogen bond interactions with Gly-62, Val-63, Arg-71, Ile-57 and Val-63 protein active site residues while M2 and native ligand chloramphenicol is involved through three hydrogen bonds with the binding site residues (Gly-62, Val-63, Ile-57) and (Ser41, Gln-61, Arg-110), respectively. M1 and M2 as bound with the target protein through hydrophobic interactions, with the active site residues Val-43, Val-63, Ala-67 and Val-68, as shown in Figure 14 and 15, respectively. The docking results suggest that M1 and M2 are potential Staphylococcus epidermidisTcaR protein inhibitors and may be useful for the antibacterial drug development process.
Conclusion
The optimized structure, atomic Mulliken charges, molecular electrostatic potential, HOMO-LUMO energy gaps, and some other molecular characteristics of5-Methoxy-1H-benzo[d]imidazole-2(3H)-thione (M1) and 4, 5- Dimethylbenzimidazolene-2-thione (M2)molecules, using DFT theory with B3LYP/6-311+G(d,p) level basic set, have been analyzed. The optimized parameters, by and large, agree well with the X-ray data. The HOMO-LUMO energy gap of M2 is slightly lower than that of M1, indicating that the molecular structure of M2 is more favorable for charge transfer than that of M1.The Hirshfeld surface analysis indicates that the critical interactions happening in the molecular structure results in π-π stacking (in M1). The proportion of volume occupied by voids in M1 and M2 is 0.36 % and 16.10 %, respectively, indicating that the physical strength of structure M1 is far greater than that of M2. The energy framework analysis reveals that electrostatic and dispersion components in both the structures have a major role to play in the total lattice energy. These findings suggest that packing density, packing manner, intermolecular interactions are inclusively expressed by the hydrogen bonds. The other non-hydrogen interactions, the amount of voids present in unit cell and interaction energies aresome of the governing factors that affect physical properties such as hardness and tablet-ability. In silico molecular docking results of imidazole compounds (M1 and M2) against S. epidermidis protein 4EJV reveal higher binding scoring pose (-10.2 kcal/mol and -9.4 kcal/mol) compared to chloramphenicol (−9.1 kcal/mol). These outcomes enable us to consider M1 and M2to act as lead molecules for potential S. epidermidis inhibitors and could be used in antibacterial drug design processes.
Acknowledgement
Rajni Kant is thankful to the University of Jammu for funding under the RUSA- 2.0 project of the Government of India.
Conflict of interest
All authors declare no conflict of interest.
Funding source
RUSA- 2.0 project of the Government of India.
Reference
- A. Howard, M. O’Donoghue, A. Feeney and R. D Sleator, Acinetobacter baumannii: an emerging opportunistic pathogen. Virulence. 3, 243 (2012).
CrossRef - K. Montefour, J. Frieden, S. Hurst, C. Helmich, D. Headley, M. Martin and D. A. Boyle, Acinetobacter baumannii: an emerging multidrug-resistant pathogen in critical care.Crit. Care Nurse 28, 15 (2008).
CrossRef - E. A. Bancroft, Antimicrobial resistance: it’s not just for hospitals. Jama 298, 1803 (2007).
CrossRef - Y. M. Chang, W. Y. Jeng, T. P. Ko, Y. J. Yeh, C. K. Chen and A. H. Wang, Structural study of TcaR and its complexes with multiple antibiotics from Staphylococcus epidermidis. Proc. Natl. Acad Sc. U.S.A. 107, 8617 (2010).
CrossRef - P. S. Stewart and J. W. Costerton, Antibiotic resistance of bacteria in biofilms. The lancet 358, 135 (2001).
CrossRef - C. A. Fux, J. W. Costerton, P. S. Stewart and P. Stoodley, Survival strategies of infectious biofilms. Trends in microbial. 13, 34 (2005).
CrossRef - U. Kalinowska-Lis, A. Felczak, L. Chęcińska, K. Lisowska and J. Ochocki, Synthesis, characterization and antimicrobial activity of silver (I) complexes of hydroxymethyl derivatives of pyridine and benzimidazole. J. Organomet. Chem. 749 394 (2014).
CrossRef - P. Bandyopadhyay, M. Sathe, S. Ponmariappan, A. Sharma, P. Sharma, A. K. Srivastava and M. P. Kaushik, Exploration of in vitro time point quantitative evaluation of newly synthesized benzimidazole and benzothiazole derivatives as potential antibacterial agents. Bioorganic Med. Chem. Lett. 21, 7306 (2011).
CrossRef - V. Klimešová, J. Kočı́, M. Pour, J. Stachel, K. Waisser and J. Kaustová, Synthesis and preliminary evaluation of benzimidazole derivatives as antimicrobial agents. Eur J. Med. Chem. 37, 409 (2002).
CrossRef - N. O. Anastassova, D. Y. Yancheva, M. A. Argirova, V. V. Hadjimitova and N. G. Hristova-Avakumova, In vitro assessment of the antioxidant activity of new benzimidazole-2-thione hydrazone derivatives and DFT study of their mechanism of action. Bulgarian Chem. Comm. 51, 186 (2019).
CrossRef - H. Khaldi, A. Djafri, Y. Megrouss, N. Khelloul and A. Chouaih, Molecular and crystal structure, Hirshfeld analysis and DFT investigation of 5-(furan-2-ylmethylidene) thiazolo [3, 4-a] benzimidazole-2-thione. Acta Crystallogr. Section E: Crystallogr. Commun. 76, 1832 (2020).
CrossRef - M. Odabaşoğlu, O. Büyükgüngör, B. Narayana, A. M. Vijesh and H. S. Yathirajan, 5-Methoxy-1H-benzo [d] imidazole-2 (3H)-thione. Acta Crystallogr Sect E: Struct. Rep. Online 63, o3199 (2007).
CrossRef - E. E. Simanek, A. Tsoi, C. C. Wang, G. M. Whitesides, M. T. McBride and G. T. Palmore, Benzimidazolene-2-thiones: A new class of molecules for the engineering of molecular tapes in the organic solid state. Chem. Mater. 9, 1954 (1997).
CrossRef - M. J. Frisch, G. W. Trucks, H. B. Schlegel, G. E. Scuseria, M. A. Robb, J. R. Cheeseman, G. Scalmani, V. Barone, B. Mennucci, G. A. Petersson, H. F. Nakatsuji, J. B. Foresman, J. V. Ortiz, J. Cioslowski and D. J. Gaussian 09 Revision A, 1 (2009).
CrossRef - P. R. Spackman, M. J. Turner, J. J. McKinnon, S. K. Wolff, D. J. Grimwood, D. Jayatilaka and M. A. Spackman, CrystalExplorer: a program for Hirshfeld surface analysis, visualization and quantitative analysis of molecular crystals. J. Appl. Crystallogr.54, (2021).
CrossRef - C. Vuong, J. M. Voyich, E. R. Fischer, K. R. Braughton, A. R. Whitney, F. R. DeLeo and M. Otto, Polysaccharide intercellular adhesin (PIA) protects Staphylococcus epidermidis against major components of the human innate immune system. Cell microbiol. 6, 269 (2004).
CrossRef - K. K. Jefferson, D. B. Pier, D. A. Goldmann and G. B. Pier, The teicoplanin-associated locus regulator (TcaR) and the intercellular adhesin locus regulator (IcaR) are transcriptional inhibitors of the ica locus in Staphylococcus aureus. J. Bacteriol. Res. 186, 2449 (2004).
CrossRef - R. Dennington, T. A. Keith and J. M. Millam, GaussView, version 6.0. 16, (2016).
- M. A. Spackman and J. J. McKinnon, Fingerprinting intermolecular interactions in molecular crystals. Cryst. Eng. Comm. 4, 378 (2002).
CrossRef - J. J. McKinnon, M. A. Spackman and A. S. Mitchell, Novel tools for visualizing and exploring intermolecular interactions in molecular crystals. Acta Crystallogr Sect B: Struct Sci Cryst. Eng. Mater. 60, 627 (2004).
CrossRef - J. J. McKinnon, D. Jayatilaka and M. A. Spackman, Towards quantitative analysis of intermolecular interactions with Hirshfeld surfaces. Chem. Commun. 3814 (2007).
CrossRef - M. A. Spackman and D. Jayatilaka , Hirshfeld surface analysis. Cryst. Eng. Comm. 11, 19 (2009).
CrossRef - M. Ashfaq, M. N. Tahir, S. Muhammad, K. S. Munawar, A. Ali, G. Bogdanov and S. S. Alarfaji, Single-Crystal Investigation, Hirshfeld Surface Analysis, and DFT Study of Third-Order NLO Properties of Unsymmetrical Acyl Thiourea Derivatives. ACS omega 6, 31211 (2021).
CrossRef - M. Fallah-Mehrjardi, H. Kargar, R. Behjatmanesh-Ardakani, M. Ashfaq, K. S. Munawar, and M. N. Tahir, Symmetrical Pd (II) and Ni (II) Schiff base complexes: Synthesis, crystal structure determination, spectral characterization, and theoretical studies. J. Mol. Struct. 28, 132037 (2021).
CrossRef - S. S. Hasanova, L. N. Mamedova, M. Ashfaq, K. S. Munawar, E. M. Movsumov, M. Khalid, M. N. Tahir and M. Imran, Synthesis, crystal structure, Hirshfeld surface analysis and theoretical investigation of polynuclear coordination polymers of cobalt and manganese complexes with nitrobenzene and pyrazine. J. Mol. Struct. 1250, 131851 (2022).
CrossRef - M. N. Ahmed, M. Ghias, S. W. Shah, M. Shoaib, M. N. Tahir, M. Ashfaq, M. A. Ibrahim, H. Andleeb, D. M. Gil and A. Frontera, X-ray characterization, Hirshfeld surface analysis, DFT calculations, in vitro and in silico lipoxygenase inhibition (LOX) studies of dichlorophenyl substituted 3-hydroxy-chromenones. New J. Chem. 45, 19928 (2021).
CrossRef - M. J. Turner, J. J. McKinnon, D. Jayatilaka and M. A. Spackman, Visualisation and characterisation of voids in crystalline materials. Cryst. Eng. Comm.13, 1804 (2011).
CrossRef - M. J. Turner, S. Grabowsky, D. Jayatilaka and M. A. Spackma, Accurate and efficient model energies for exploring intermolecular interactions in molecular crystals. J Phys Chem Lett. 5, 4249 (2014).
CrossRef - A. J. Edwards, C. F. Mackenzie, P. R. Spackman, D. Jayatilaka and M. A. Spackman, Intermolecular interactions in molecular crystals: what’s in a name? Faraday Discuss 203, 93 (2017).
CrossRef - RCSB PDB – 4EJV: Staphylococcus epidermidis TcaR in complex with chloramphenicol (Last Accessed 17- Sep, 2021).
- G. M. Morris, R. Huey, W. Lindstrom, M. F. Sanner, R. K. Belew, D. S. Goodsell and A. J. Olson, AutoDock4 and AutoDockTools4: Automated docking with selective receptor flexibility. J. Comput. Chem. 30, 2785 (2009).
CrossRef - R. Huey and G. M. Morris, Using AutoDock 4 with AutoDocktools: a tutorial. The Scripps Research Institute USA 8, pp.54 (2008).
CrossRef - O. Trott and A. J. Olson, AutoDock Vina: Improving the speed and accuracy of docking with a new scoring function, efficient optimization, and multithreading. J.Comput. Chem. 31, 455 (2010).
CrossRef - D. S. BIOVIA, BIOVIA discovery studio visualize. Software version 20, p.779 (2016).
CrossRef - C. F. Macrae, I. Sovago, S. J. Cottrell, P. T. Galek, P. McCabe, E. Pidcock, M. Platings, G. P. Shields, J. S. Stevens, M. Towler and P. A. Wood, Mercury 4.0: From visualization to analysis, design and prediction. J. Appl. Crystallogr. 53, 226 (2020).
CrossRef - R. S. Mulliken, “Electronic Population Analysis on LCAO-MO Molecular Wave Functions I”. J. Chem. Phys. 23, 1833 (1955).
CrossRef - K. Fukui, T. Yonezawa and H. Shingu, A molecular orbital theory of reactivity in aromatic hydrocarbons. J. Chem. Phys.20, 722 (1952).
CrossRef - A. F. Jalbout, B. Trzaskowski and A. J. Hameed, Theoretical investigation of the electronic structure of 1-(3, 4; 3, 5 and 3, 6-bis-selenocyanato-phenyl) pyrrolidinofullerenes. J. Organomet. Chem. 691, 4589 (2006).
CrossRef - A. F. Jalbout, A. J. Hameed and B. Trzaskowski, Study of the structural and electronic properties of 1-(4, 5 and 6-selenenyl derivatives-3-formyl-phenyl) pyrrolidinofullerenes. J. Organomet. Chem. 692, 1039 (2007).
CrossRef - R. Manne and T. Åberg, Koopmans’ theorem for inner-shell ionization. Chem. Phys. Lett. 7, 282 (1970).
CrossRef - M. Ashfaq, G. Bogdanov, V. Glebov, A. Ali, M. N. Tahir and S. Abdullah, Single crystal investigation, Hirshfeld surface analysis and DFT exploration of the pyrimethamine-based novel organic salt: 2, 4-diamino-5-(4-chlorophenyl)-6-ethylpyrimidin-1-ium 3-carboxybenzoate hydrate (1: 1: 1). J. Mol. Struct. 1224, 129309 (2021).
CrossRef - M. Ashfaq, G. Bogdanov, A. Ali, M. N. Tahir and S. Abdullah, Pyrimethamine-Based Novel Co-Crystal Salt: Synthesis, Single-Crystal Investigation, Hirshfeld surface analysis and DFT inspection of the 2, 4-diamino-5-(4-chlorophenyl)-6-ethylpyrimidin-1-ium 2, 4-dichlorobenzoate (1: 1)(DECB). J. Mol. Struct. 1235, 130215 (2021).
CrossRef - M. Ashfaq, K. S. Munawar, G. Bogdanov, A. Ali, M. N. Tahir, G. Ahmed, A. Ramalingam, M. M. Alam, M. Imran, S. Sambandam and B. Munir, Single crystal inspection, Hirshfeld surface investigation and DFT study of a novel derivative of 4-fluoroaniline: 4-((4-fluorophenyl) amino)-4-oxobutanoic acid (BFAOB). J. Iran. Chem. Soc. 27, 1 (2021).
CrossRef - H. Kargar, R. Behjatmanesh-Ardakani, M. Fallah-Mehrjardi, V. Torabi, K. S. Munawar, M. Ashfaq and M. N. Tahir, Ultrasound-based synthesis, SC-XRD, NMR, DFT, HSA of new Schiff bases derived from 2-aminopyridine: Experimental and theoretical studies. J. Mol. Struct. 1233, 130105 (2021).
CrossRef - S. K. Seth, I. Saha, C. Estarellas, A. Frontera, T. Kar and S. Mukhopadhyay, Supramolecular self-assembly of M-IDA complexes involving lone-pair··· π interactions: crystal structures, hirshfeld surface analysis, and DFT calculations [H2IDA= iminodiacetic acid, M= Cu (II), Ni (II)]. Cryst. growth des. 11, 3250 (2011).
CrossRef - M. J. Turner, J. J. McKinnon, D. Jayatilaka and M. A. Spackman, Visualisation and characterisation of voids in crystalline materials. Cryst. Eng. Comm. 13, 1804 (2011).
CrossRef - H. Kargar, M. Fallah-Mehrjardi, R. Behjatmanesh-Ardakani, K. S. Munawar, M. Ashfaq and M. N. Tahir, Titanium (IV) complex containing ONO-tridentate Schiff base ligand: Synthesis, crystal structure determination, Hirshfeld surface analysis, spectral characterization, theoretical and computational studies. J. Mol. Struct. 1241, 130653 (2021).
CrossRef - H. Kargar, M. Fallah-Mehrjardi, R. Behjatmanesh-Ardakani, M. N. Tahir, M. Ashfaq and K. S. Munawar, Synthesis, crystal structure determination, Hirshfeld surface analysis, spectral characterization, theoretical and computational studies of titanium (IV) Schiff base complex. J. Coord. Chem. 26, 1 (2021).
CrossRef - H. Kargar, M. Fallah-Mehrjardi, R. Behjatmanesh-Ardakani, K. S. Munawar, M. Ashfaq and M. N. Tahir, Diverse coordination of isoniazid hydrazone Schiff base ligand towards iron (III): Synthesis, characterization, SC-XRD, HSA, QTAIM, MEP, NCI, NBO and DFT study. J. Mol. Struct. 1250, 131691 (2022).
CrossRef
Views: 661
 This work is licensed under a Creative Commons Attribution 4.0 International License.
 , Saminathan Murugavel2
 , Ravikumar Chandrasekaran2
 and Rajni Kant1*
 Material Science Research India An International Peer Reviewed Research Journal


