Saima Wani1  , Hasham S. Sofi2
  , Faheem A. Sheikh2
  , S. A. Shivashankar3
  and Shafquat Majeed2*
1Department of Biochemistry, Sher-e-Kashmir University of Agricultural Sciences and Technology, Shalimar Campus, Srinagar-190025, Jammu and Kashmir, India
2Department of Nanotechnology, University of Kashmir, Hazratbal, Srinagar-190006, Jammu and Kashmir, India
3Centre for Nano Science and Engineering, Indian Institute of Science, Bangalore-560012, India
Corresponding author Email: smshah@uok.edu.in
DOI : http://dx.doi.org/10.13005/msri/140205
Article Publishing History
Article Received on : 24 Nov 2017
Article Accepted on : 30 Nov 2017
Article Published : 06 Dec 2017
Plagiarism Check: Yes
Article Metrics
ABSTRACT:
Nanocrystalline ZnGa2O4 spinel powders were prepared through a simple and facile microwave-irradiation assisted solution-based route, using ethylene glycol as the reaction medium and, without using any structure-directing agents. The as-prepared product consists of ZnGa2O4 nanoparticles, which are crystalline as revealed by X-ray diffraction studies and TEM analysis. Transmission electron microscopy (TEM) and scanning electron microscopy (SEM) studies also show that, the size of these as-prepared nanoparticles is less than 10 nm. The annealed nanopowders show intense blue luminescence, under UV excitation, which makes these nanopowders important in the field of phosphor applications.
KEYWORDS:
Luminescence; Microwave-assisted; Nanocrystalline materials; Phosphor; Spinel
Copy the following to cite this article:
Wani S, Sofi H. S, Sheikh F. A, Shivashankar S. A, Majeed S. ZnGa2O4 Nanophosphors: Rapid Synthesis, Characterization and Luminescence Properties. Mat.Sci.Res.India;14(2)
|
Copy the following to cite this URL:
Wani S, Sofi H. S, Sheikh F. A, Shivashankar S. A, Majeed S. ZnGa2O4 Nanophosphors: Rapid Synthesis, Characterization and Luminescence Properties. Mat.Sci.Res.India;14(2). Available from: http://www.materialsciencejournal.org/?p=6490
|
Introduction
ZnGa2O4 is a transparent conductive oxide with a wide energy band gap of ~ 4.4 eV.1,2 Being a ternary oxide that can be formed by the reaction between ZnO and Ga2O3, ZnGa2O4 crystallizes in the cubic spinel-type (AB2O4) structure. The tetrahedrally coordinated A-sites are occupied by Zn2+ ions, whereas, Ga3+ ions fill the octahedrally coordinated B-sites.3 ZnGa2O4 shows emission in the blue region without any dopant via excitation of self-activated optical centers linked to Ga−O groups, which are tetrahedrally coordinated.4 Because of its improved stability than sulphide phosphors, it has received a lot of interest in the domain of field-emission and fluorescent vacuum displays, and also in electroluminescent devices.5 ZnGa2O4 has also been investigated for its excellent cathodoluminescence properties at lower voltages. Pure zinc gallate shows a characteristic blue emission peak in the wavelength range of 430–450 nm, and this peak has been ascribed to the presence of defect states within the host lattice. However, it is well known that the emission characteristics of undoped ZnGa2O4 are relatively sensitive to various factors, such as the conditions of synthesis, (and the consequent) distortion around Ga3+ ions which, apparently, lead to the observed unexpected line profiles. For example, Kim et al. attributed the presence of 360 nm emission in reduced ZnGa2O4 powders to distorted GaO6 octahedra, that are responsible for the oxygen vacancies within the crystal lattice.6 It was also observed that, when a sample is heated in a reducing environment, the oxygen vacancies created in the lattice lead to the distortion of GaO6 octahedral geometry. Such distortion can increases the energy gap between Ga3+ and O2- energy levels, which leads to a decrease in the emission wavelength. Furthermore, oxidizing this sample in air leads to the disappearance of 360 nm peak, confirming the contribution of oxygen vacancies to the observed emission.
In the recent years, microwave-assisted route has been used to synthesize a variety of inorganic materials from different classes.12,13 In this paper, we present a simple, facile microwave-irradiation based surfactant-free synthesis route for the preparation of ultra-small ZnGa2O4 nanoparticles using the acetylacetonates of Zn and Ga as the starting precursors, and ethylene glycol as the reaction solvent. It is worthwhile to mention here that, the whole reaction completes in just 22 minutes, make this a rapid and energy efficient process, in comparison to solid-state route or other solution-based methods like hydrothermal/solvothermal, which can take hours to days for synthesising such materials. In case of these metal acetylacetonates, the fragile M-O bonds, that can break easily in a chemical reaction, makes them very good starting materials for the preparation of various metal oxides.7–10 Ethylene glycol as the reaction medium has its own advantages like high boiling point (197 °C) and very high tan δ value of 1.35 (highly efficient in converting microwave energy into thermal energy). A further advantage of using ethylene glycol can be its growth-directing ability, because of the presence of lone pair of electrons on the two oxygen atoms that may bind to nanoparticle surface, stabilising them, thus performing the dual function of solvent and surfactant. Furthermore, the microwave-assisted solution based method can be a preferred route for nanomaterial synthesis because of its various attributes like increased reaction rates, homogenous heating and energy efficiency.11 Also in the reaction medium, the thermal energy is distributed uniformly because the microwave field energy is transferred directly to it, which results in ubiquitous nucleation that promotes nanocrystallinity and monodispersity in the product.
Materials and Methods
For the preparation of ZnGa2O4 nanopowders, 1 mmol (0.28 g) of zinc (II) acetylacetonate monohydrate and 2 mmol (0.73 g) of gallium trisacetylacetone (corresponding to a Zn:Ga mole ratio of 1:2) were dissolved in 50 ml of ethylene glycol in a sealable 80 ml glass vessel. A clear solution obtained after 5 minutes of continuous stirring was microwave-irradiated in a mono-mode microwave synthesiser (operating at 2.45 GHz, CEM-Discover, USA). This clear solution is heated to 200 ºC and then held at this temperature for another 20 minutes. The microwave power is switched off after 20 minutes, and the reaction vessel was allowed to cool to room temperature. A white precipitate is obtained, which is isolated from the solution by centrifugation at 4000 rpm. The precipitate is washed several times with acetone, and the obtained powders are dried in a hot-air oven at 70 °C for 10 h for further studies.
The phase purity of products was examined by powder x-ray diffraction (XRD) using a PANalytical X’Pert PRO diffractometer (Cu-Kα radiation, λ = 1.54 Å). Field-emission scanning electron microscopy (FE-SEM, SIRION XL-40) and transmission electron microscopy (TEM, Technai-G20, 200 kV) were used to study morphology and the crystallinity of the nanopowders. Selected area electron diffraction (SAED) patterns were recorded in TEM to study the structure of the nanoparticles, and elemental analysis was carried out by using EDAX (attached to SEM and TEM). Fourier transform infrared (FT-IR, Bruker) transmittance spectra in the range of 4000–400 cm-1 were collected in KBr pellets. The photoluminescence (PL) emission spectra of the powder samples were collected at room temperature with an excitation wavelength of 325 nm (He-Cd laser, Horiba Jobin-Yvon), and the Raman spectra were obtained using an argon ion laser of wavelength 514 nm using the same instrument (accumulation time is 25 seconds).
Results and Discussions
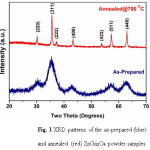
Fig. 1 shows the XRD patterns of the as-prepared product and the powder material annealed at 700 °C for 2 h in air. The results indicate that the samples are well crystallized, and all the XRD peaks in the as-prepared and the annealed powder samples are in good agreement with cubic ZnGa2O4 (JCPDS 00-038-1240). However, there is a marked difference between the peak shapes of as-prepared and annealed powders. The diffraction peaks are very broad in case of as-prepared powders, indicating that the particle size is very small. By applying the Scherer equation to calculate the particle size using peak broadening (full width at half maximum), the particle size of the as-prepared powders is deduced to be 3.5 nm whereas, as a result of annealing, the crystallite size in the annealed powder is significantly larger at 19 nm. No impurity phases were present that can be observed in the experimental range.
Figure 1: XRD patterns of the as-prepared (blue) and annealed (red) ZnGa2O4 powder samples.
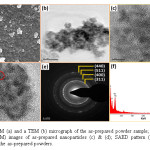
The as-prepared ZnGa2O4 powders were analysed by SEM and TEM. Fig. 2(a) represents the SEM image and 2(b) shows the high magnification TEM image of the as-prepared powders; it can be readily seen that the as-prepared powders contains aggregates of nanoparticles of very small sizes. High-resolution TEM images (HRTEM) shown in Fig. 2(c) and 2(d) show that the size of these nanoparticles is considerably less than 10 nm and that they are of different shapes. The nanoparticles are indeed crystalline, as they display clear lattice fringes as seen in the red circled areas of Fig. 2(d), thus supporting the XRD data. Fig. 2(e) shows the SAED pattern of the as-prepared ZnGa2O4 nanopowders. A ring-type diffraction pattern is observed, and these diffraction rings gave d-spacing value corresponding to the most intense reflections of cubic ZnGa2O4, viz., the (311), (400), (511) and (440) crystal planes.
Figure 2: A SEM (a) and a TEM (b) micrograph of the as-prepared powder sample; High resolution TEM (HRTEM) images of as-prepared nanoparticles (c) & (d); SAED pattern (e); and EDAX profile (f) of the as-prepared powders.
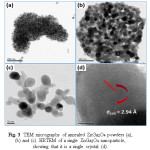
The EDAX (or EDS) spectrum of the as-prepared ZnGa2O4 powders show the presence of Zn, Ga, O, C (from the organic moieties of the precursors and the solvent) and Cu (TEM grid). The obtained weight percentage of Zn, Ga and O from EDS data matches favourably with the theoretical values calculated for ZnGa2O4. Fig. 3 shows the morphology and microstructure of annealed ZnGa2O4 powders. Fig. 3(a) and 3(b) shows that the sample contains aggregates of nanoparticles forming mesh-like structures. The crystallite size has also increased (> 20 nm) as a result of annealing, Fig. 3(c). Further, as evident from Fig. 3(d), each of these nanoparticles is single crystal. The d-spacing calculated from the lattice fringes corresponds to the (220) interplanar distance.
Figure 3: TEM micrographs of annealed ZnGa2O4 powders (a), (b) and (c). HRTEM of a single ZnGa2O4 nanoparticle, showing that it is a single crystal (d).
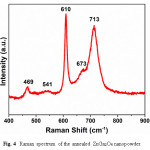
The Raman spectrum of the annealed ZnGa2O4 powder is shown in Fig. 4. In case of spinel structures like ZnGa2O4, the related phonon modes have been assigned at г = A1g + Eg + T1g + 3T2g + 2A2u + 2Eu + 5T1u + 2T2u.14–16 While the 4T1u modes are infra-red active, the A1g + Eg + 3T2g modes are Raman active.14–16 These are the first order Raman modes and these modes have their origin in Zn2+ ions located in the tetrahedral holes, and doesn’t depend on the motion of Ga3+ ions occupying the octahedral sites. The Raman peaks at 469 and 611 cm-1 are due to T2g modes, and the A1g mode is responsible for 713 cm-1 Raman peak. The weak second order Raman lines are present at 541 and 673 cm-1. Moreover, the Raman peak around 673 cm-1 has been also shown to appear due to excess ZnO; the “disordered peak” well known in spinel compounds.17
Figure 4: Raman spectrum of the annealed ZnGa2O4 nanopowder.
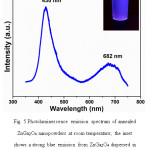
Fig. 5 represents the photoluminescence emission spectrum of annealed ZnGa2O4 nanopowder at room temperature. The PL spectrum shows two broad peaks, viz., a strong blue emission peak centered at 430 nm and a weak broader peak centered at 682 nm. In case of undoped ZnGa2O4 phosphors, it is a well-established fact that the inherent blue emission originates from the self-activation center of Ga–O octahedral group. This process involves a transfer of charge between Ga3+ ions located at the center of octahedral sites and its six first-neighbor O2− ions.18 A blue shift observed in this work, vis-à-vis the usual emission shown at 450-470 nm by ZnGa2O4 phosphors prepared by various methods, may be due to the quantum-confinement effects stemming from the very small crystallite size of the present sample of ZnGa2O4.19 It has also been suggested that the existence of singly charged oxygen vacancies (which depends on synthesis conditions and annealing environment) within the ZnGa2O4 nanoparticles may be responsible for the appearance of a small broad peak in the PL spectrum, centered at 682 nm.20
Figure 5: Photoluminescence emission spectrum of annealed ZnGa2O4 nanopowders at room temperature; the inset shows a strong blue emission from ZnGa2O4 dispersed in ethanol, under UV excitation
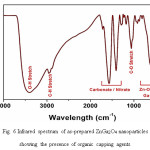
It must be noted that the as-prepared nanoparticles show no luminescence under UV excitation. This may be due to their extremely small size (hence a lot of unsatisfied bonds, leading to PL quenching), as well as the presence of organic capping agents, which have been found to be efficient quenching agents. Indeed, the IR spectrum of the as-prepared ZnGa2O4 powder (Fig. 6) confirms the presence of organic residues on their surface, as indicated by the presence of peaks at 2900 cm-1 (C-H stretch) and 1050 cm-1 (C-O stretch). The IR spectrum also shows the characteristic metal-oxygen vibrations of Zn–O and Ga–O at 616 and 445 cm−1, respectively, in addition to absorptions due to O-H stretching at 3400 cm-1 and carbonates/nitrates at 1570/1400 cm-1. The very strong O-H absorption probably indicates the presence of ethylene glycol, the reaction solvent, which may effectively coat the surface of the nanoparticles formed.
Figure 6: Infrared spectrum of as-prepared ZnGa2O4 nanoparticles showing the presence of organic capping agents.
Conclusion
In conclusion, nanocrystalline ZnGa2O4 powders having size <5 nm were prepared through a simple, facile microwave-irradiation assisted method without utilising any structure-directing agents. The as-synthesised nanoparticles are crystalline, as shown by XRD and TEM analysis. Whereas the as-prepared nanoparticles don’t show any luminescence due to their small size and the presence of quenching organic capping agents as (shown by the IR spectrum), the annealed ZnGa2O4 nanopowder shows a strong blue emission under UV excitation, in addition to a weak emission in the red, , making it potentially useful in luminescence applications.
Acknowledgments
The authors acknowledge gratefully the Centre for Nano Science and Engineering (CeNSE) and the Advanced Facility for Microscopy and Microanalysis (AFMM) of the Indian Institute of Science, Bangalore, India, for supporting analyses by photoluminescence, SEM, and IR. SM thanks the University Grants Commission (UGC), New Delhi, India, for the award of a research fellowship.
Conflict of interest
We have no conflicts of interest to disclose and the manuscript has been approved by all authors.
Funding Source
Furthermore, this work has been funded by the Science and Engineering Research Board (SERB) research grants (ECR/2016/001429 & ECR/2017/000205).
References
- Kamal C. S., Boddu S., Vishwanadh B., Rao K. R., Sudarsan V., Vatsa R. K. J. Lumin. 2017;188:429–435.
CrossRef
- Omata T., Ueda N., Ueda K., Kawazoe H. Appl. Phys. Lett. 1994;64:1077–1078.
CrossRef
- Fan H. J., Yang Y., Zacharias M. J. Mater. Chem. 2009;19:885–900.
CrossRef
- Chen X., Fei G., Yan J., Zhu Y., . De Zhang L. Nanoscale Res. Lett. 2010;5:1387.
CrossRef
- Byun H. J., Kim J. U., Yang H. Nanotechnology. 2009;20:495602.
CrossRef
- Kim J. S., Kang H. I., Kim W. N., Kim J. I., Choi J. C., Park H. L., Kim G. C., Kim T. W., Hwang Y. H., Mho S. I. Appl. Phys. Lett. 2003;82:2029–2031.
CrossRef
- Saleh T. A.,Majeed S., Nayak A., Bhushan B. Adv. Nanomater. Water Eng. Treat. Hydraul. IGI Global. 2017:40–57.
CrossRef
- Majeed S., Bashir M., Shivashankar S. A. J. Nanoparticle Res. 2015;17:1–15.
CrossRef
- Majeed S., Shivashankar S. A. J. Mater. Chem. 2014;2:5585–5593.
CrossRef
- Majeed S., Shivashankar S. A. Mater. Lett. 2014;125:136–139.
CrossRef
- Majeed S., Shivashankar S. A. Mater. Chem. Phys. 2013;143:155–160.
CrossRef
- Majeed S., Shivashankar S. A. J. Mater. Chem. 2014;2:2965–2974.
CrossRef
- Bilecka I., Niederberger M. Nanoscale. 2010;2:1358–74.
CrossRef
- Kang H. I., Kim J. S., Lee M., Bahng J. H.,Choi J. C., Park H. L., Kim G. C., Kim T. W.,Hwang Y. H., Mho S. I. Solid State Commun. 2002;122:633–636.
CrossRef
- Can M. M., Jaffari G. H., Aksoy S., Shah S. I., Fırat T. J. Alloys Compd. 2013;549:303–307.
CrossRef
- Van Gorkom G. G. P., Haanstra J. H. J. Raman Spectrosc. 1973;1:513–519.
CrossRef
- Iida Y., Okazaki M. Anal. Sci. 2001;17:1145–1147.
CrossRef
- Liu B., Bando Y., Dierre B., Sekiguchi T., Tang C., Mitome M., Wu A., Jiang X., Golberg D. Nanotechnology. 2009;20:365705.
CrossRef
- Cao M., Djerdj I., Antonietti M., Niederberger M. Chem. Mater. 2007;19:5830–5832.
CrossRef
- Xu L., Su Y., Zhou Q., Li S., Chen Y., Feng Y. Cryst. Growth Des. 2007;7:810–814.
CrossRef
Views: 1,949
 This work is licensed under a Creative Commons Attribution 4.0 International License.
 , Hasham S. Sofi2
  , Faheem A. Sheikh2
  , S. A. Shivashankar3
  and Shafquat Majeed2*
 Material Science Research India An International Peer Reviewed Research Journal

