Finite Element Analysis (FEA) Based Frequency Optimization of Vertical Storage Column
Introduction
The vertical storage column is typically a leak proof tank which is used to store the liquid and fine powder. The column which is used in this case is used to stored ethanol. To expand the capacity limit, these segments are generally exceptionally tall commonly over 27 meters with a circular cross segment. The test presented is that the agitator and the vertical section are needed to be on a similar stage. Because of this the Column is powerless to vibrations from the Agitator. The frequency created by the agitator is legitimately relative to the revolutions every moment (rpm). On the off chance that the frequency produced by the agitator matches with the natural frequency of the Vertical Column then such a resonance will make the section vibrate at max adequacy and may even bring to Failure. The issue can be settled by expanding the characteristic natural frequency of the section. Natural frequency is a component of the mass (m) and the solidness (k)/in the event that we enhance these boundaries utilizing basic alterations we can expand Natural frequency and afterward we can work the agitator at higher rpm minimizing the creation time C. Design target is to improve production by at least 20. This will need to optimize the natural frequency of the column. Stiffeners /Support are fond to the column plate to reinforce the column compared to pressure loads, to decrease vibrations of the plate and to stiffen plate compared to buckling. Stiffeners essential be spaced at some appropriate spacing so that plate stress is less than allowable stress. If column panel height or width is less than allowable plate span then theoretically column does not requires stiffeners/support. However if column lifted or handles in one piece then, some stiffening may be necessary to maintain column shape. In any case stiffener /support become integral part of column’s structural system. Stiffener/Support may also function as column supports as well as plate reinforcement. Stiffeners [1-2] are generally most part welded to the segment divider are different techniques to join.
Increase the stiffness by increasing stiffeners/supports leads to weight increase so no real difference in frequency. By reducing mass of column and that can be possible only by selecting proper material. The objective of entire work is to design of the vertical column in such a way that the natural frequency of the column can be optimized.
Literature review
2010 ASME Codes Section-VIII Division-II. [3], ASME is the most well up in standard creating associations in America. It delivers around 600 codes and norms covering many specialized zones, for example, clip, plumbing connections, lifts, pipelines, and force plant frameworks and parts. ASME’s standards are created by advisory groups of topic specialists utilizing an open, agreement based cycle. Many ASME standards are refered to by government organizations as apparatuses to meet their administrative purposes. ASME principles are consequently considered, except if the standards have been fused into a lawfully restricting business contract or joined into guidelines upheld by an authority having purview, for example, an administrative, state, or neighborhood government organization. ASME’s principles are utilized in excess of 100 nations and have been converted into various languages. The biggest ASME standard, both in size and in the quantity of volunteers engaged with its arrangement, is the ASME Boiler and Pressure Vessel Code (BPVC). The BPVC gives rules to the plan, creation, establishment, examination, care, and utilization of boiler, pressure vessels and atomic parts. The code likewise remembers norms for materials, welding and brazing techniques and capabilities, nondestructive assessment, and atomic in-administration review.
W. F. English et al. [4], developed “fatigue Design Criterion For Pressure Vessel Alloys”. The researcher have brought up two crucial issues which they have not replied. To begin with, for what reason should the 1961 mean bend, which precisely spoke to 146 information focuses somewhere in the range of 10 and 108 cycles, be altogether change. Also, what are the specialized defenses for stretching out the mean bend to 10s by utilizing a generally modest number of burden controlled tests? Changing a set up mean bend, having a fantastic information fit, a huge mathematical information base, and 15 years of fruitful experience requires solid avocation. The creators’ model and ward variable were equivalent to Langer’s. Once more, why the proposed changes to the current Langer bend, the essential explanation has all the earmarks of being the way wherein the information is fit to the model.
Y. Bangash [5], has proposed “Safe Analysis For Cooling Pipes For Prestressed Concrete Reactor Vessels”. A bit by bit investigation is given for the immediate calculation of two-dimensional warmth stream to and safe pitching of the cooling pipes. Two models of the cooling framework have been chosen and computations have been done for a current vessel. On one model this investigation is contrasted and the three-dimensional limited component examination for getting protection conductance for different cooling pipe pitches.
A. S. Tooth et al. [6], has introduced the diagnostic methodology for “The Thermal Behavior Of Thin Cylindrical Shells. (Versatile Thermal Stress Analysis)”. The twofold Fourier arrangement warm pressure arrangement is introduced. This depends on Sanders’ direct shell hypothesis with extra warm stacking terms The pressure arrangements got in these cases are contrasted and limited component results. The strategy is brisk and effectively programmable and, as a coordinated bundle, is especially reasonable for assessing the impact on the feelings of anxiety of conceivable warmth move conditions.
Wanmin Hant et al. [7], has proposed “Direct Vibration Analysis of Laminated Rectangular Plates Using the Hierarchical Finite Element Method-I. Free Vibration Analysis”. Vibration examination of evenly overlaid, rectangular plates with cinched limit conditions is considered utilizing the progressive limited component strategy. Emblematic calculation is utilized to assess the integrals of the results of expected higher request polynomials that happen when processing the inactivity and solidness networks.
Roman W. Motriuk et al. [8], has proposed technique for “Quick, Wide-Field Measurements Of Complex Transient Shell Vibrations”. The planning and assessment of complex vibration fields is frequently exceptionally attractive in the weight vessel and channeling industry. It is likewise dull and costly utilizing traditional innovation, for example, strain gage and accelerometer clusters. This paper portrays field and research center estimations made with a compact beat laser framework that immediately catches uprooting information over territories up to 2 m2, with submicron affectability. An extra objective is to expand the productivity of clamor reduction arrangements utilizing understanding got from wide-field vibration estimations.
M.H. Toorani [9], has introduced “Elements Of The Geometrically Non-Linear Analysis Of Anisotropic Laminated Cylindrical Shells”. An overall methodology, in view of shearable shell hypothesis, to foresee the impact of mathematical non-linearities on the common frequencies of a versatile anisotropic overlaid round and hollow shell fusing enormous removals and pivots is introduced in his work.
You-Hong Liu et al. [10], has watched “Breaking point Pressure and Design Criterion of Cylindrical Pressure Vessels with Nozzles”. Breaking point pressures and comparing most extreme nearby film Stress Concentration Factors (SCF) are surveyed for two symmetrically meeting slender walled barrel shaped shells exposed to inward weight. The plastic breakdown pressures got by 3D FEM are in acceptable concurrence with test results introduced by past creators. The nearby layer SCF at the convergences of two barrel shaped shells exposed as far as possible weight load is determined by versatile meager shell hypothetical arrangements introduced by Xue and Hwang.
Jaroslav Mackerle [11], has introduced “Limited Elements In The Analysis Of Pressure Vessels And Piping, An Addendum”. It gives a bibliographical audit of limited component strategies (FEMs) applied for the investigation of weight vessel structures/parts and channeling from the hypothetical just as functional perspectives. This list of sources is another addendum to the Finite components in the examination of weight vessels and channeling—a book index [1–3].
by completing above literature survey it is discovered that the vessel that is situated vertically, there is an possibility of twisting. At the point when the height of vessel is so enormous the above issue gets critical. So in such cases it is important to complete dynamic analysis of vessel in addition to structure investigation.
FAE analysis
The little size nozzle, channel outlet pipe and other mounting and accessories are not consider with the work of pre-stressed modal analysis.(Because the heaviness of these devices are little contrasted and weight of the whole segment). The vertical storage segment is considered as thin pressure vessel in light of (diameter to thickness ratio is greater than 20). The 3D model is coincided with first order shell component (SHEEL 63). The every one of vertical help are fix into singular solid section. For static investigation the welding isn’t need to recreate on the grounds that the weld material and parent material are thought to be same (and the pressure is free from the material).therefore whole structure is consider as a ceaseless structure.
The structural analysis of the column is carried out in order to check whether the column structure is safe or not under the given boundary condition. Due to the presence of contact at the junction of reinforcement pad to the cylindrical shell of column the analysis become non linear static structural analysis. Due to large structure of column the weight of column is taken into account by applying gravity to the structure. The weight of the ethanol is simulated by scaling the density of structure.
Model of vertical storage column
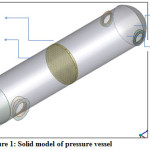
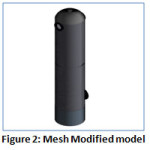
Following figure shows vertical solid pressure vessel Assembly design with two input nozzle which is at horizontal position & one output nozzle which is at lower portion of the vessel. Tube-sheet is mounted in the Shell. Initially we generate solid in Workbench model by using all calculated constraints and ASME Code Section-VIII, Div-II, and next meshing the solid model extra nodes are produced but ability of system not enough, so generate next model in surface. In surface modelling no. of nodes are cuts 40-60 % as match to solid model, which are beneath the ability to my system.
Figure 1: Solid model of pressure vessel
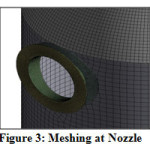
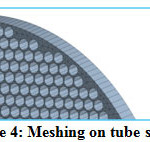
Material used for the pressure vessel is SA516GR70 Steel are use. The properties of the material are described in subsequent table by using Reference of ASME Code Section-VIII, Div-I. Page no.50 Basic methodology of finite element method is to prepare calculations at only restricted number of points and then interpolate the results for entire domain i.e. surface and volume. Steps Involved in Meshing Pressure Vessel in ANSYS are selection of element type for meshing and creating simplified parts & meshing the parts.
Figure 2: Mesh Modified model
Figure 3: Meshing at nozzle.
Figure 4: Meshing on tube sheet.
SHELL93 is especially appropriate suited to model shells. The component has six degrees of opportunity at every node: interpretations in the nodal x-direction, y-direction, and z- directions and revolutions about the nodal x-axes, y-axes, and z-axes. The elongated shapes are quadratic in both in-plane directions. The component has plasticity, stress stiffening, large deflection, and large strain abilities.
Static Structural Analysis
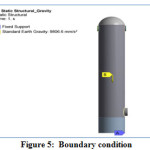
Applying Boundary Condition Are As Follows, For Pressure Vessel Analysis With Self Weight:
1. Skirt support is fixed.
2. Gravity acting downwards
Figure 5: Boundary Condition
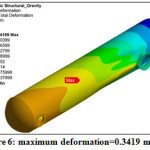
Figure 6: Maximum Deformation=0.3419 mm
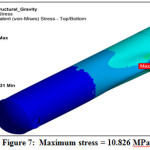
Figure 7: Maximum Deformation=0.3419 mm
The gravity results display extreme deformation is 0.3419 mm and maximum stress is 10.82 MPa. At these vessel is safe for self-weight.
Static Structural Analysis
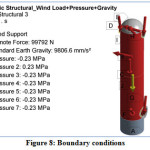
Case-01: Applying Boundary Condition for Pressure Are As Follows,
1. Apply Internal Pressure = 0.23MPa
2. Wind load (Remote force) = 99792 N
3. On Skirt Support applied Fix support constrain
Figure 8: Boundary Conditions
Applying internal Pressure of 0.23 MPa on all bodies of pressure vessel& using remote force of 99792 N, which is acting on the circumference of the vessel.
From below chart & Table we did the meshing comparison at different node & element sizes
Table 2: Maximum Stress for Different number of Nodes
|
Sr. No.
|
No. of Nodes
|
Stress(mpa)
|
Deformation(mm)
|
|
1
|
60663
|
298.9
|
6.7177
|
|
2
|
91704
|
367.17
|
7.1943
|
|
3
|
120775
|
298.86
|
7.5601
|
|
4
|
149987
|
342.9
|
8.3247
|
|
5
|
179313
|
390.69
|
8.605
|
|
6
|
213726
|
324.68
|
8.7378
|
|
7
|
236546
|
333.88
|
8.9017
|
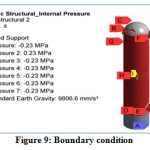
Case-02: This case is solved for the for the internal pressure to check maximum stress & deformation at 0.23 MPa pressure & gravity
Boundary Condition:
1.Internal pressure = 0.23 MPa
2.Standard Earth gravity = 9.8 m/s2
3.Applied fix constrain at skirt base
Use the same boundary condition of case-01 and with Standard Earth Gravity
Figure 9: Boundary Condition.
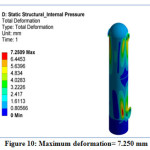
Figure 10: Maximum Deformation= 7.250 mm.
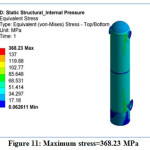
Figure 11: Maximum Stress=368.23 MPa
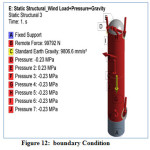
Case-03: For the next condition we have applied Internal Pressure 0.23, with wind load & standard gravity
Boundary Condition:
1.Internal pressure = 0.23 MPa
2.Wind force = 99792 N
3.Standard Earth gravity = 9.8 m/s2
4.Applied fix constrain at skirt base
Figure 12: boundary Condition,
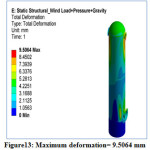
Figure 13: Maximum deformation= 9.5064 mm
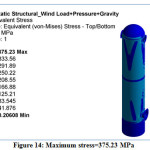
Figure 14: Maximum stress=375.23 MPa
In above case the maximum deformation 9.5 mm in vertical pressure vessel although it is safe for self weight because , maximum stress(von-mises) is less than total stress (i.e. membrane stress, S + bending stress, 2S) where S= allowable stress, 137.89 MPa.
Therefore, vertical column is safe from structure point of view. In order to perform pre stress modal analysis, it is neccesary to perform structure analysis first then same FEA model is forwaded for pre stressed modal analysis.
Case 04
Solid Tube-sheet Optimization at pressure 0.23 MPa
Applying boundary condition for optimization of single tube-sheet thickness
1.Fixed support
2.Rub in pressure= 0.23 MPa
Table 4: Extreme Stress &Extreme Deformation results for Different Thickness of tube-sheet
| Sr. No. |
Thickness |
Maximum Deformation (mm) |
Maximum Stress (MPa) |
| 1 |
288 |
1.2553 |
47.499 |
| 2 |
280 |
1.3307 |
50.397 |
| 3 |
260 |
1.6538 |
58.9 |
| 4 |
240 |
2.0922 |
69.705 |
| 5 |
220 |
2.7027 |
83.709 |
| 6 |
200 |
3.578 |
102.28 |
| 7 |
180 |
4.88 |
127.58 |
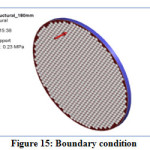
Figure 15: Boundary condition.
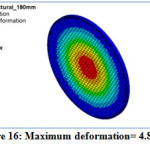
Figure 16: Maximum deformation= 4.88 mm.
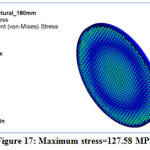
Figure 17: Maximum stress=127.58 MPa.
Tube-sheet is investigated for pressure of 0.23MPa, reducing the tube-sheet thickness from 288 mm to achieved the peak thickness. The stress at 180 mm thickness of tube-sheet is 127.58 MPa which is nearby and minimum than permissible stress. So the final Optimum thickness for tube-sheet at pressure of 0.23 MPa is decided at 180mm
Case05
Tube-sheet Optimization with Point Load and pressure of 0.05 MPa
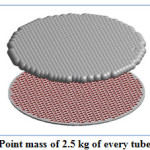
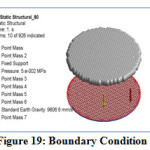
Optimised 180 mm thickness of tube-sheet with rub on Gravity, point mass 2.5 kg of every tube on mid-point of tube length and pressure on tube-sheet 0.05 MPa,a number of analysis are as follows.
Total number of Tubes = 923 Mass of each tube = 2.5 kg
Total mass of all tubes on the tube sheet =2.5*923 = 2307.5 kg
Figure 18: Point mass of 2.5 kg of every tube at its C.G.
Table 5: Maximum Stress And Maximum Deformation results for Different Thickness of tube-sheet with mass of each tube at its C.G.
| Sr. No. |
Thickness |
Maximum Deformation (mm) |
Maximum Stress (MPa) |
| 1 |
180 |
1.4419 |
37.686 |
| 2 |
160 |
1.9934 |
47.122 |
| 3 |
140 |
2.8833 |
60.782 |
| 4 |
120 |
4.4224 |
81.616 |
| 5 |
100 |
7.3412 |
102.82 |
| 6 |
90 |
9.8378 |
121.87 |
| 7 |
80 |
13.63 |
135.32 |
Figure 19: Boundary Condition
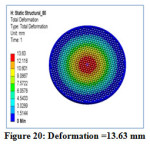
Figure 20: Deformation =13.63 mm
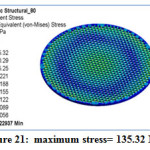
Figure 21: maximum stress= 135.32 MPa
Tube-sheet analysis with Point Load 2.5 kg of each tube and pressure of 0.05MPa is done with decreasing the tube-sheet thickness to obtained the optimum thickness. The stress at 80 mm thickness of tube-sheet is 135.32MPa which is nearest and less than allowable stress. So the final Optimum thickness for tube-sheet with Point Load of each tube and Pressure of 0.05MPa is decided at 80mm.
Pre-stressed Modal analysis
A modal analysis defines the vibration characteristics (natural frequencies and equivalent mode shapes) of a structure or a machine element.The natural frequency of a structure is the frequency value at the structure naturally tends to vibrate if it is subjected to pulse.We increase the natural frequency by following ways:
1. By increasing stiffness
2. By reducing mass
Natural frequency of vertical storage vessel
Model without support:
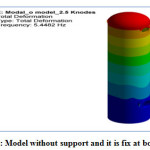
Model without support and it is fix at bottom face is shown in fig.22.
Figure 22: Model without support and it is fix at bottom face
The natural frequency of above model is increased to 5.6622 Hz as shown in fig. 29. Inclined plates are added in between two horizontal plates as shown in fig.30.
The natural frequency of model without support is calculated as 5.4482 Hz that is shown in fig.22.
Model with side support: By using plates of various dimensions
With plate dimension 5000X5000X12mm
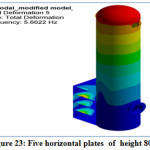
1.1)Five horizontal plates of height 8000 mm are attached to the one side of the model as shown in fig.23.
Figure 23: Five horizontal plates of height 8000
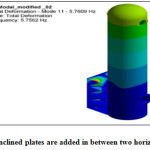
The natural frequency of above model is increased to 5.6622 Hz as shown in fig. 29. Inclined plates are added in between two horizontal plates as shown in fig.30.
Figure 24: Inclined plates are added in between two horizontal plates
The natural frequency of above model is increased to 5.7609 Hz as shown in fig.24.
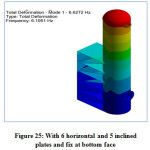
1.3)With 6 horizontal and 5 inclined plates and fix at bottom face as shown in fig.24
Figure 25: With 6 horizontal and 5 inclined plates and fix at bottom face
The natural frequency of above model is increased to 6.6272 Hz as shown in fig.25.
With plate dimension 5000X5000X24mm
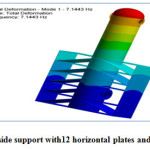
2.1) Two side support with12 horizontal plates and 8 inclined plates as shown in fig.26.
Figure 26: Two side support with12 horizontal plates and 8 inclined plates
The natural frequency of above model is increased to 7.1473 Hz as shown in fig. 26.
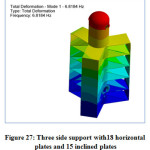
2.2) Three side support with18 horizontal plates and 15 inclined plates as shown in fig.26
Figure 27: Three side support with18 horizontal plates and 15 inclined plates
The natural frequency of above model is decreased to 6.8184 Hz as shown in fig. 27.
3)With plate dimension 1000X3000X30mm
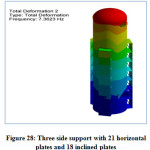
3.1) Three side support with 21 horizontal plates and 18 inclined plates and fix at bottom as shown in fig.28
Figure 28: Three side support with 21 horizontal plates and 18 inclined plates
The natural frequency of above model is increased to 7.3623 Hz as shown in fig.28
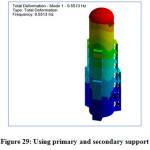
3.2) Using primary and secondary support: As shown in fig.29.
Figure 29: Using primary and secondary support
The natural frequency of above model is increased to 9.5513 Hz as shown in fig. 29. Now, we increase the height of primary and secondary support with the same number of plates of same thickness as shown in fig.29.
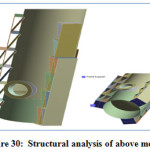
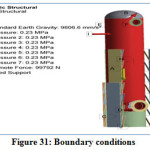
Figure 30: Structural analysis of above model Fig.31. Boundary conditions
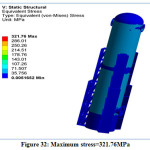
Boundry conditions are shown in fig.30 and maximum(von-mises) stress is shown in fig. 31.
Figure 31: Boundary conditions
Figure 32: Maximum stress=321.76MPa
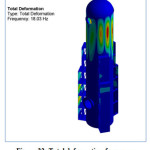
Figure 33: Total deformation frequency
By increasing height of primary and secondary support we got natural frequency of vertical storage column 18.03 Hz as shown in fig.6.45. Here, we got natural frequency of model is 18.03 Hz i.e. we got the targeted frequency which is greater than 16 Hz.
Results and Discussions
Result Obtained after Structure Analysis tube sheet
Solid Tube-sheet Optimization at pressure 0.23 MPa
Tube-sheet is analysed used for pressure of 0.23MPa, reducing the tube-sheet thickness from 288
mm to found the optimum thickness. The stress at 180 mm thickness of tube-sheet is 127.58 MPa which is close and less than permissible stress. So the concluding Optimum thickness for tube-sheet at pressure of 0.23 MPa is decided at 180mm.
Table 3: Maximum Stress And Maximum Deformation results for Different Thickness of tube-sheet
| Sr. NO. |
Thickness |
Maximum Deformation (mm) |
Maximum Stress (MPa) |
| 1 |
288 |
1.2553 |
47.499 |
| 2 |
280 |
1.3307 |
50.397 |
| 3 |
260 |
1.6538 |
58.9 |
| 4 |
240 |
2.0922 |
69.705 |
| 5 |
220 |
2.7027 |
83.709 |
| 6 |
200 |
3.578 |
102.28 |
| 7 |
180 |
4.88 |
127.58 |
Tube-sheet Optimization with Point Load and pressure of 0.05 MPaTube-sheet analysis with Point Load 2.5 kg of each tube and pressure of 0.05MPa is complete with lessening the tube-sheet thickness to obtainthe optimum thickness. The stress at 80 mm thickness of tube-sheet is 135.32MPa which is nearest and less than allowable stress. So the final Optimum thickness for tube-sheet with Point Load of each tube and Pressure of 0.05MPa is decided at 80mm.
Table 4: Extreme Stress &Extreme Deformation results for Different Thickness of tube-sheet with mass of every tube at its C.G.
| Sr. No. |
Thickness |
Maximum Deformation (mm) |
Maximum Stress (MPa) |
| 1 |
180 |
1.4419 |
37.686 |
| 2 |
160 |
1.9934 |
47.122 |
| 3 |
140 |
2.8833 |
60.782 |
| 4 |
120 |
4.4224 |
81.616 |
| 5 |
100 |
7.3412 |
102.82 |
| 6 |
90 |
9.8378 |
121.87 |
| 7 |
80 |
13.63 |
135.32 |
Result Obtained After Structure Analysis of vertical storage column.
In case the maximum deformation 9.5 mm in vertical pressure vessel although it is safe for self weight because , maximum stress(von-mises) is less than total stress (i.e. membrane stress, S + bending stress, 2S) where S= allowable stress, 137.89 MPa. Maximum stress, 375.23 MPa < total stress, 413.67 MPa, Therefore, vertical column is safe from structure point of view.
Table 5: shows the maximum deformation and maximum stress with different boundry condition
| Sr No |
Boundary condition |
Stress(MPa) |
Dmx(mm) |
| 1 |
Gravity+wind load |
8.744 |
0.3463 |
| 2 |
Gravity+pressure |
368.23 |
7.25 |
| 3 |
Gravity+pressure+wind load |
375.90 |
9.50 |
In order to perform pre stress modal analysis, it is necessary to perform structure analysis first then same FEA model is forwarded for prestressed modal analysis.Pre Stressed Modal Analysis: With plate dimension 5000X5000X12mmNatural frequency of vertical column 6.7906 Hz is received .so we have to increase the natural frequency by changing the plate thickness.
Table 6: The natural frequency of model with increasing support plates.
| Number of horizontal support |
Number of inclined support |
Height(mm) |
Frequency (Hz) |
| 5 |
– |
8000 |
5.6662 |
| 5 |
4 |
8000 |
5.783 |
| 6 |
5 |
10000 |
6.6272 |
| 12 |
8 |
10000 |
6.6102 |
| 18 |
15 |
10000 |
6.7906 |
With plate dimension 5000X5000X24mm Maximum natural frequency of vertical column 7.1443 Hz is recieved. so we have to increase the natural frequency by changing the plate thickness.
Table 7: shows the natural frequency of model with increasing support plates
| Number of horizontal support |
Number of inclined support |
Height(mm) |
Frequency (Hz) |
| 5 |
4 |
15000 |
6.0721 |
| 6 |
5 |
18000 |
6.2772 |
| 12 |
8 |
18000 |
7.1443 |
| 18 |
15 |
18000 |
6.8184 |
With plate dimension 1000X3000X30mm
Maximum natural frequency of vertical column 7.3623 Hz is reieved. so we have to increase the natural frequency but we cannot increase the plate thickness more than 30mm so we can add secondary support to it as shown in fig.15
Table 8: The natural frequency of model with increasing support plates
|
Number of horizontal support
|
Number of inclined support
|
Height
|
Frequency (Hz)
|
|
24
|
21
|
20000
|
7.3623
|
Using primary and secondary support
Table 9: The natural frequency of model with primary and secondary support plates
| Number of horizontal support |
Number of inclined support
|
Height
|
Frequency (Hz)
|
| Primary -24 |
21
|
20000
|
9.5513
|
|
Secondary – 15
|
12
|
11428.14
|
The frequency is 9.551 Hz so we have to increase the frequency by increasing height of primary and secondary support.
Using primary and secondary support
Table 10: Shows the natural frequency of model with primary and secondary support plates
|
Number of horizontal support
|
Number of inclined support
|
Height(mm)
|
Frequency (Hz)
|
|
Primary -24
|
21
|
22000
|
18.03
|
|
Secondary – 15
|
12
|
12571.42
|
The output obtained from modal analysis are frequencies and mode shapes. In order to obtain a percentage increase in frequency, comparision of fundamental frequency or first mode frequency of actual model of a column with a modified model of column to be carried out because agitator is only source of vibration. Our aim is to achieve fundamental frequency of model is greater than 16 Hz by optimize structure of column.1) As number of supports(horizontal) are increasing the natural frequency of column is also increasing, but at same time weight is also increased. So in order to optimize design the weight of column provided by support must be reduced.2) After optimize the structure of support and carrying out pre stressed modal analysis the targated natural frequencies(>16 Hz) is obtained in the structure (as determine in FIG:5.18).
Conclusion
Structure Analysis
1.The stress induced by applying given boundry condition in last case is less than permissible or design stress value .
2. All the cases exhibits stress genereted is less than allowable or design stress.
3.After carrying out structural analysis it is prooved that the given model (i.e fig.6.42) is safe from strength and rigidity point of view.
4.Selected model is forwaded for pre stressed modal analysis.
Pre-stressed Modal Analysis
1.As the number of support increases the natural frequency of column are increase but at the same time weight of the structure are also increase so the design are not optimize.
2.In order to optimized the design it is necessary to reduce the weight of column as much as possible by maintaining same structural stiffness.
3.By keeping in mind above consideration there are various model of column with different layout of support are developed. The last model as shown in fig.6.42 is achieving targeted natural frequency or more than and it is safe from structural point of view so we finalised that model.FEA analysis carried out in present work are very helpful in order to increase natural frequency of any vessles that is oriented vertically by adding some supports/stiffeners or making some structural modification.
Funding Source
This research received no specific grant from any funding agency.
Acknowledgement
Authors would like to acknowledge efforts by all research team from D. Y. Patil Institute of Technology, Pune who have helped to conduct experiments and collection of data.
References
- Desai, S., Desai, A., & Karande, V. (2020). Design and weight optimization of buffer relief valve using FEA with experimental validation. Materials Today: Proceedings.
CrossRef
- “Higher-OrderFinite ElementMethods” by PAVEL SOLIN, Rice University, Houston, Texas. KAREL SEGETH, Academy of Sciences of the Czech Republic, Prague.IVO DOLEZEL, Czech Technical University, Prague.A CRC Press Company Boca Raton London New York Washington, D.C. © 2004 by Chapman & Hall/CRC.
- De Borst, R., Crisfield, M. A., Remmers, J. J., & Verhoosel, C. V. (2012). Nonlinear finite element analysis of solids and structures. John Wiley & Sons.
CrossRef
- Jaske, C. E., & O’donnell, W. J. (1977). Fatigue design criteria for pressure vessel alloys.
CrossRef
- Bangash, Y. (1979). Safe analysis for cooling pipes for prestressed concrete reactor vessels. Nuclear Engineering and Design, 55(3), 305-313.
CrossRef
- Sumit Desai. (2014). Development Of Thermo-Physical Model Of Powder Mixed Electrical Discharge Machine Using Fem And Experimental Validation. Int J Adv Engg Tech/Vol. V/Issue II/April-June, 107, 111.
CrossRef
- Han, W., & Petyt, M. (1996). Linear vibration analysis of laminated rectangular plates using the hierarchical finite element method—I. Free vibration analysis. Computers & structures, 61(4), 705-712.
CrossRef
- Motriuk, R. W., & Schmidt, T. (2001). Rapid, wide-field measurements of complex transient shell vibrations. J. Pressure Vessel Technol., 123(4), 537-543.
CrossRef
- Toorani, M. H. (2003). Dynamics of the geometrically non-linear analysis of anisotropic laminated cylindrical shells. International journal of non-linear mechanics, 38(9), 1315-1335.
CrossRef
- Liu, Y. H., Zhang, B. S., Xue, M. D., & Liu, Y. Q. (2004). Limit pressure and design criterion of cylindrical pressure vessels with nozzles. International journal of pressure vessels and piping, 81(7), 619-624.
CrossRef
- Mackerle, J. (2005). Finite elements in the analysis of pressure vessels and piping, an addendum: A bibliography (2001–2004). International Journal of Pressure Vessels and Piping, 82(7), 571-592.
CrossRef
- Mackenzie, D., Camilleri, D., & Hamilton, R. (2008). Design by analysis of ductile failure and buckling in torispherical pressure vessel heads. Thin-walled structures, 46(7-9), 963-974.
CrossRef
- Xue, L., Widera, G. E. O., & Sang, Z. (2010). Parametric FEA study of burst pressure of cylindrical shell intersections. Journal of pressure vessel technology, 132(3).
CrossRef
- Khazaeinejad, P., Najafizadeh, M. M., Jenabi, J., & Isvandzibaei, M. R. (2010). On the buckling of functionally graded cylindrical shells under combined external pressure and axial compression. Journal of pressure vessel technology, 132(6).
CrossRef

This work is licensed under a Creative Commons Attribution 4.0 International License.
 , Ganesh Bhalerao1, Amit Desai2
 Material Science Research India An International Peer Reviewed Research Journal

